· What if we divide Relative Runs by balls faced across the 2026 IPL season for the best batters? · Sooryavanshi leads this new metric, followed by two LSG batters, just like for ЯR/Inns · Despite a similar top three, this stat highlights other players (Rickleton in top five, Rizvi and Mhatre make top 15)
One thing that has bothered me for a while is how to elegantly dovetail Relative Runs (ЯR) with the number of balls faced by batsmen to capture a sense of strike rates in the analysis of the numbers.
I have largely been dividing ЯR by batters’ number of innings for longer tournaments like the IPL, as in my larger analysis pieces (see those here: 2025, 2026). This has made intuitive sense and provides a nice way of averaging out Relative Runs over a campaign, in order to analyse batters’ contributions.
However, something has been nagging at me. In T20 cricket specifically, we care about how many balls a batter faces: how many balls they soak up on their way to runs, or rather, how many balls they don’t need to reach a score.
The question was: Is there a way to link this idea to Relative Runs, without referring to Relative Strike Rates (another stat I have invented), or classic strike rates? And then it came to me – so simple and effective – why not just divide the total Relative Runs by the balls faced by a batter across a season?
This is a slightly different way of looking at the numbers across a tournament than via number of innings, but maybe one more in tune with what matters in T20 cricket. That’s because we do care if batters face fewer balls on their way to higher scores, or higher relative scores. We want to highlight the relatively large contributors to a total as well as the quick or efficient contributors.
To explore this idea, I’ve taken another look at the Relative Runs stats I compiled from the 2026 IPL season, and created a new stat: Relative Runs per Ball Faced, or ‘ЯR/BF’. Creating this stat was very simple: I just took the total Relative Runs score for each batter in the season and divided that by their total balls faced for the campaign.
For this analysis, I decided to look at just the top 64 run scorers from the season – that’s the batters who scored at least 150 runs. When we take those batters’ ЯR scores and divide them by balls faced, here is the basic breakdown of the numbers:
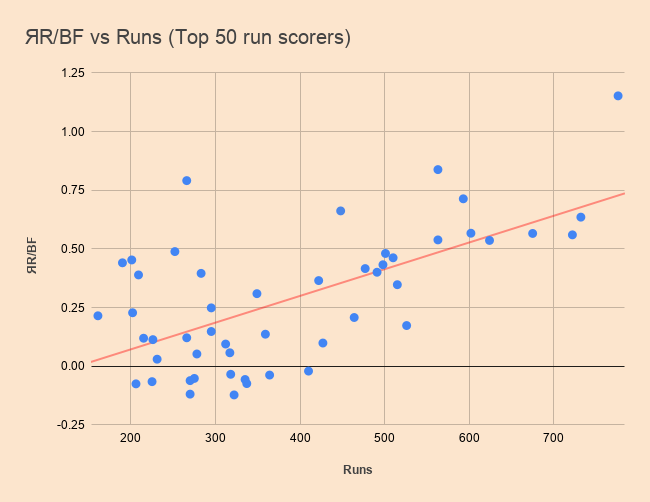
ЯR/BF vs runs for the top 50 run scorers in the 2026 IPL season
39 batters notched positive scores, while the remaining 25 of the 64 are in negative values. This is the same as for the ЯR/Inns analysis, because it follows that the positive and negative values of the core ЯR scores do not change when divided by different digits (innings or balls faced).
11 of the batters collected ЯR/BF scores over 0.5. This means these 11 batters, arguably the best few, were the only players to score more than 0.5 Relative Runs per ball during the season, on average. Four batters scored over 0.7 ЯR/BF, while just one scored over 1.0 ЯR/BF. Let’s dive in a little deeper…
Sooryavanshi the star (again), Marsh and Inglis impress
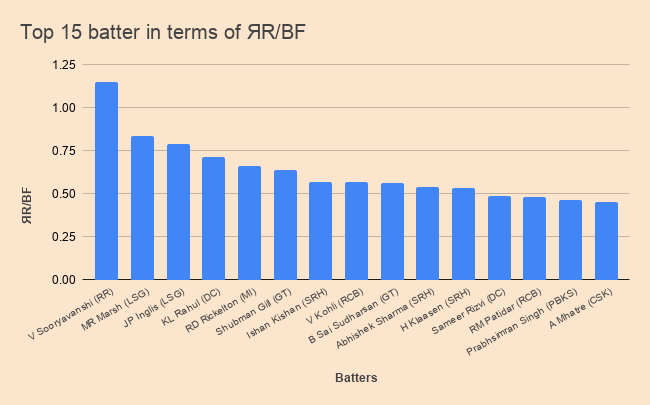
No guesses for who the positive outlier was! Vaibhav Sooryavanshi was the one single batter to generate an ЯR/BF score over 1.0 (1.152). The next best was Mitch Marsh at 0.838. To put this in other terms, Sooryavanshi was the only player in the entire 2026 season to average more than one Relative Run per ball faced.
What does that mean? This is where the concept of a ‘Relative Run’ can get confusing. This is not the same as saying he scored one run more than his teammates per ball faced, but rather that for every ball he faced, he averaged one run more than the Par score of his teammates in each innings. Quite something!
Breaking this down a bit: If Sooryavanshi were to face 10 balls in an innings, we could expect him to score 11.52 more runs than the Par score of his team in that innings. Here’s another fun way to think about that: Sooryavanshi would only need about nine deliveries (8.68, to be precise) to reach 10 Relative Runs. Meaning, on average for the season, Sooryavanshi only needed to face nine balls to eclipse his side’s Par score by 10 runs. That is both slightly mind-bending and damning of his teammates, in equal measure.
For comparison, Marsh, the next best ЯR/BF scorer, needed about 12 balls to score 10 Relative Runs for LSG. Virat Kohli, who notched the eighth-best ЯR/BF score for the season, needed to face almost 18 balls to get 10 Relative Runs for RCB – twice as many as Sooryavanshi. Rohit Sharma needed to face a touch over 25 balls for the same mark. Sooryavanshi’s opening partner at Rajasthan, Yashasvi Jaiswal, had to face 101 balls (in theory) to be expected to score 10 Relative Runs for the Royals in 2026. This is perhaps where it gets a little abstract, but you see the point.
The top 15 batters in terms of ЯR/BF for the 2026 IPL season
All this is just more ways of proving the same thing: Sooryavanshi had a phenomenal 2026 season. Not just relative to his team, or in terms of these novel stats, but also compared to the entire competition. He scored the most runs at the fastest pace; he got the most Relative Runs, as well as the most Relative Runs per innings and ball faced, too. There really isn’t much competition for him in those terms, but there are some interesting findings further down the list. So who else excelled in terms of ЯR/BF?
Top performers according to the metric
As mentioned, Marsh notched the second-best ЯR/BF score (0.838), and he was followed by his LSG teammate Josh Inglis, who finished on 0.791 and edged Marsh in the ЯR/Inn stats. Both of their scores were close in the two metrics, but this is an interesting finding because Inglis batted at a higher strike rate for the season (186.01 vs 163.18), and yet scored lower on ЯR/BF. Marsh’s overperformance in terms of scoring relative to his teammates has powered his ЯR/BF past his peer with a superior strike rate for the season, surprisingly.
Delhi’s KL Rahul comes in fourth place on 0.713 ЯR/BF, and rounding out the top five is Mumbai’s Ryan Rickleton with 0.662. It is interesting to see how this top five looks a bit different to the top five in terms of ЯR/Inns, with Rahul rising past Shubman Gill (0.635), and Rickleton leapfrogging also Kohli (0.566), Sai Sudharshan (0.560), and Heinrich Klaasen (0.536) in this metric.
Filling out the top 11 of players who tipped over 0.5 for ЯR/BF are Klaasen’s SRH teammates Ishan Kishan (seventh at 0.567) and Abhishek Sharma (10th at 0.538). Punjab’s top scorer, Prabsimram Singh, was in the top 11 for ЯR/Inns but in terms of ЯR/BF he comes in at 14th, with 0.462.
Generally speaking, the guys with slightly weaker strike rates have slid down the list in terms of ЯR/BF, which completely makes sense, because this new stat favours faster scorers. Conversely, guys like Ishan and Rickelton, who struck at over 180, have moved up the list in terms of ЯR/BF, which is sort of what we want to see from this stat – some dovetailing of Relative Runs and strike rates, at least to an extent.
However, this is not always the case, as highlighted by Marsh leading Inglis in terms of ЯR/BF. Marsh only struck at 163.18 for the season, scoring the eighth most runs in the league. However, it was his huge overperformance in relation to his teammates in scoring that sees him with the second most Relative Runs, and also second most per ball faced.
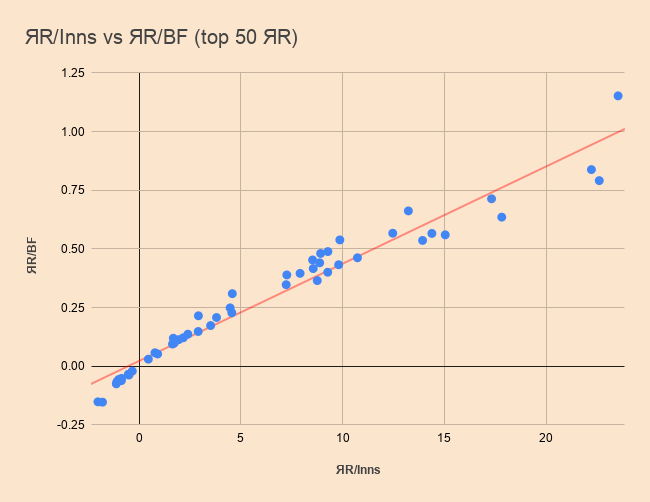
ЯR/Inns vs ЯR/BF for just the top 50 Relative Runs scorers in the season, demonstrating the linearity between the stats.
Some of the players we highlighted in the ЯR/Inns analysis also pop up high on the ЯR/BF list, too. Sameer Rizvi (0.488) was 12th best in the league; Ayush Mhatre (0.453) came in at 15th, with Rovman Powell (0.441) just one after him.
Rohit (0.396) was 20th best in terms of ЯR/BF. Sarfaraz Khan, who was one of the more surprising positive finds in the initial analysis, popped up with the 27th-best ЯR/BF score in the whole season (0.215), remarkably. To put him into context, he is wedged in between RCB stars Phil Salt (0.228)and Devdutt Padikkal (0.208) in terms of this metric in the list of 64 batters.
Poor performers according to the metric
In terms of the players whose ЯR/BF stats are not as good as their run stats look, Jos Buttler stands out. He was one of only 13 players to score over 500 runs for the season, and yet his ЯR/BF score (0.173) is 29th in the list. Jaiswal came way down in 35th place (0.099), despite scoring 427 runs.
Travis Head is a player we didn’t mention much in the ЯR/Inns analysis because his ЯR stats were just below zero, and we focused on the positive performers. Interestingly, Head was the only player to score over 400 runs and have negative ЯR numbers, landing on -0.021 for ЯR/BF. Rahul Tewatia was the worst-performing player among the top 64 batters in terms of ЯR/BF, and the only one to fetch a score lower than -1.0 (-1.488).
It’s a little overdue, but time to take a close look at the Relative Runs analysis from the 2026 IPL season. I did something similar for the 2025 season (which you can read here), and it was both fascinating and fun to see which players stood out in terms of my novel metric, Relative Runs, in the world’s premier T20 franchise league.
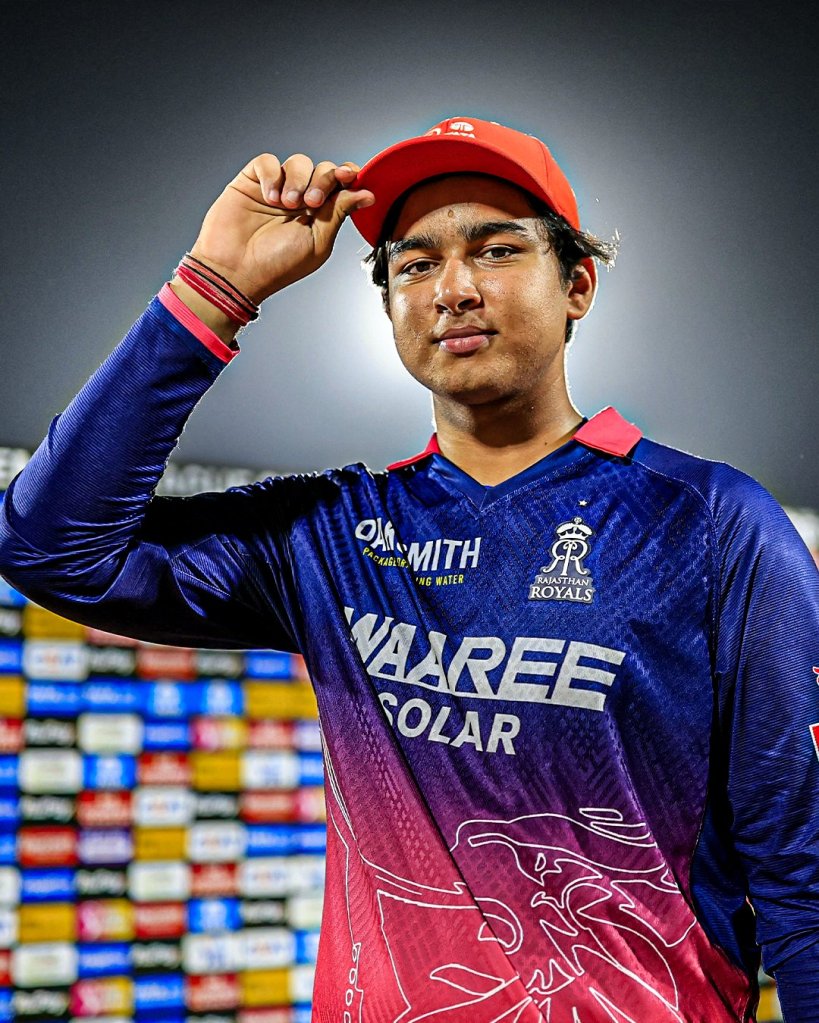
The 2026 IPL Orange Cap winner Vaibhav Sooryavanshi (credit: Rajasthan Royals)
Before we get stuck into it, a little overview of the approach is needed. It’s important before reading on to understand what Relative Runs are (from here on, ‘ЯR’)…
In short, they are a novel statistical take on runs which, like my other Relative metrics, looks to quantify the relative contribution of batters to their sides, rather than the absolute or ‘raw’ runs. The calculation is simple: you take the total of an innings minus the extras, and then divide that by the number of batters who faced a ball. This gives us our ‘Par’ score for the innings. ЯR are then determined by subtracting the Par from the actual runs scored by a particular batter.
The core idea behind the metric is that what matters for this stat is how many more or fewer runs a batter scores than the average contribution of their peers in an innings. You can read a bit more about how the stat works here.
For the recent IPL season, just like last year, I went through every match and collected ЯR scores for every batter in each innings, along with some other Relative stats, too. Once the season wrapped up, I began tallying the total ЯR scores for the top batters (the top 60 run-scorers plus a few more). I then determined the average ЯR per innings of each of those batters from across the season – simply their ЯR divided by their number of innings – to determine the key stat in what follows: ЯR/Inns.
This stat tells us how many runs a batter scored more or fewer than the Par score of his teammates, on average, throughout the season. To illustrate: a batter might gain a ЯR score of 10 in one innings, but just 2 ЯR/Inns across the season. This would indicate that he averaged 2 runs more than the Par score of his teammates throughout the season, but scored 10 more than the Par in one particular innings.
Like anything, the more data, the better. Inspecting a ЯR score is interesting, but looking at ЯR/Inns scores from across a whole season of 10-15 innings is much more illustrative of over- or under-performance. This is the main reason why my analysis tends to focus just on the batters who scored the most runs in the IPL, as they are also the ones who tended to play the most. We want to see the stat ‘in action’, so to speak, with decent-sized datasets – not just one or two innings. We will return to the discussion of sample sizes in what follows below.
To begin with, I’ll take a look at just the top 20 scorers in the 2026 IPL season, before broadening that out to the top 60, and finish with a couple of other curious outside cases and reflections. I hope you enjoy reading and find it as interesting as it was to put together!
The top 20 scorers: Sooryavanshi the star as Marsh impresses again
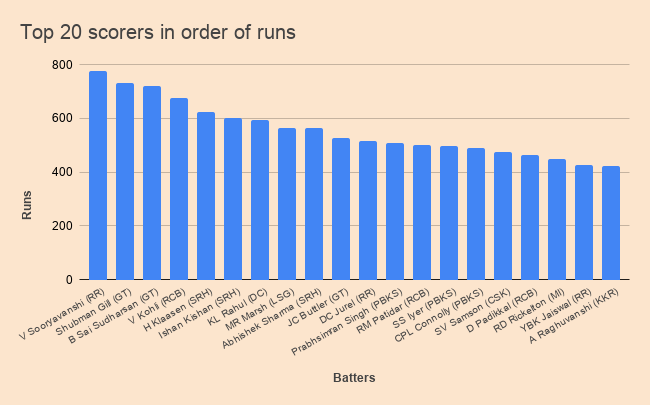
There’s only one place to start this analysis, and that is with 15-year-old sensation Vaibhav Sooryavanshi of the Rajasthan Royals. The Orange Cap winner blazed 776 runs in 16 innings at an absurd strike rate of 237.30. There are not enough words to describe his impact on the IPL, and the game at large, really.
The top 20 run-scorers in the 2026 IPL season in order of runs scored
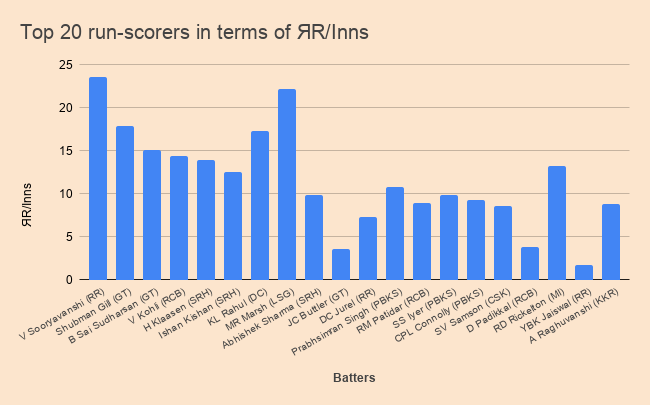
Needless to say, given his output, it’s unsurprising that he gained the highest ЯR/Inns score of the entire competition of 23.54, after a total 376.67 ЯR from 16 innings. Having scored about 25 per cent of his side’s runs in the season, it stacks up that his relative contributions across innings are going to be very high too.
To put his numbers into some context: in the previous season (2025), Mitch Marsh led the competition with a ЯR/Inns of 20.54 ahead of three players scoring between 17-18. Sooryavanshi’s heavy outscoring of his teammates and sheer weight of runs make him a logical ЯR and ЯR/Inns leader, but his numbers are nonetheless very impressive.
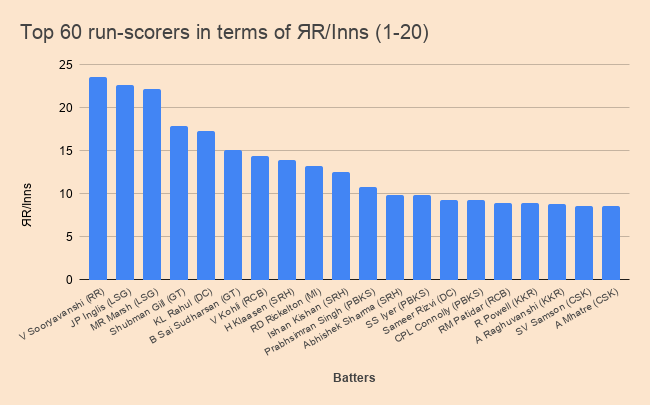
Only two other players scored more than 700 runs in the 2026 IPL – Gujarat Titans pair Shubman Gill and Sai Sudharsan. They are in the top 6 in terms of ЯR/Inns, with Gill 3rd on 17.82 and Sudharsan 5th on 15.05, among the top 20 scorers. Superstar Virat Kohli, who helped RCB to back-to-back titles, notched 14.39, which has him 6th ahead of Sunrisers’ Heinrich Klaasen (13.93) in 7th place.
The top 20 run-scorers in the 2026 IPL with their respective ЯR/Inns scores for the season
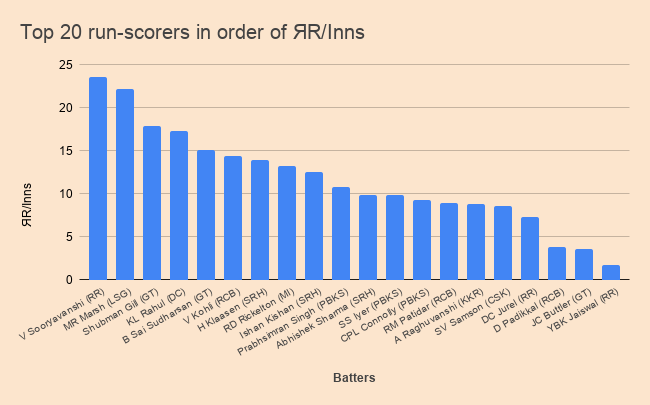
Coming in with the 2nd best ЯR/Inns score of the top 20 run-scorers is Mitch Marsh, last year’s ЯR/Inns leader in the IPL. LSG had a diabolical season, finishing dead last, but Marsh did his bit at least, scoring just shy of 21 per cent of his side’s total runs. His ЯR/Inns score of 22.23 was better than his 2025 numbers and bettered only by Sooryavanshi and one other player in the top 60 run-scorers in 2026 (more on the other below).
Delhi Capitals’ reliable and somewhat overlooked (in this format, at least) KL Rahul comes in 4th, wedged between the GT openers, in terms of ЯR/inns with a score of 17.32. By far the top scorer from DC (the only one in the top 30), Rahul goes about his business in a way that hasn’t drawn as much attention as his fellow Indian openers mentioned above, perhaps because his franchise last made the playoffs in 2021. Here’s an interesting tidbit: Only 6 players scored more runs than Rahul all season, and of those, only 2 did it at a higher strike rate – Sooryavanshi and Sunrisers’ Ishan Kishan (12.47 ЯR/Inns – 9th best of top 20).
The top 20 run-scorers in the 2026 IPL ordered in terms of their ЯR/Inns for the season
Further down this list of the top 20 scorers, Mumbai’s Ryan Rickleton stands out for having the best ЯR/inns outside the top 9 run-getters at 13.23 (8th best in top 20 batters). Rickleton was rather surprisingly dropped at one point during the campaign, only to come back into the fold. He scored more runs than any other MI player, despite only playing 12 matches. It was thus surely a mistake to drop him, and you’d hope they’ll stick with him next season to begin with.
Punjab Kings spread their runs around in what was a pretty bizarre campaign for them, winning 6 straight before losing 6 straight. Their top scorer was Prabhsimran Singh (10.73 ЯR/Inns), who, along with Rickleton, was the only other ЯR/Inns score over 10 outside the top 10 run-scorers but inside the top 40. Teammates Shreyas Iyer (9.81) and Cooper Connolly (9.27) came very close to joining that group too, however. As did RCB’s Rajat Patidar (8.92).
Another player close to the 10 mark for ЯR/Inns was KKR’s top scorer Angkrish Raguvanshi, who caught the eye last season with 6.88 ЯR/Inns, but bettered that in 2026 with 8.76. In terms of this metric, that puts him above the likes of CSK’s Sanju Samson (8.56), GT’s Jos Buttler, RCB’s Devdutt Padikkal and RR’s Yashasvi Jaiswal for 2026, who all scored more runs in the season.
Speaking of that lot… Buttler (3.52), Padikkal (3.80) and Jaiswal (1.73) all ended up on ЯR/Inns scores below 4, placing them as the lowest 3 in the top 20 run-getters according to the metric. Theirs are still positive numbers but dwarfed by their teammates.
Buttler and Padikkal, the typical No. 3s in both finalist sides, stood in the shadows of their respective openers – Gill & Sudharsan or Kohli – who tend to bat long and hog the runs, making it harder to shine in terms of ЯR for those that come in after them. Jaiswal, similarly but in a more extreme sense, scored almost 350 fewer runs than the top scorer in his team, Sooryavanshi. That goes a long way to explaining why both the teenage phenom recorded such a high ЯR score, and why Jaiswal registered under 2 ЯR/Inns.
Aside on the difference between the percentage of team runs and Relative Runs
One topic that is doing the rounds in cricket stat conversations a lot recently, and came up above, is referencing the percentage of team runs scored as opposed to just ‘raw runs’. It’s great to see, because this goes some way to exploring the relative contributions of players over absolute contributions. One quick note on this is that when looking at the 2026 IPL season, the percentage of team runs maps not perfectly but quite linearly with total runs.
What that means is that while it is a great indicator of relative contribution, in the context of a tournament like the IPL where scores do fluctuate but teams face similar conditions, the story that percentage of team runs can tell us is interesting but not as nuanced as Relative Runs. That is because Relative Runs has baked into it the difference in the weight of runs that are shared between many and few batters. To put this another way: you could score a large proportion of your team’s runs, but score few Relative Runs if the Par score is high due to fewer batters being used.
The top 60 scorers: Inglis surges into conversation
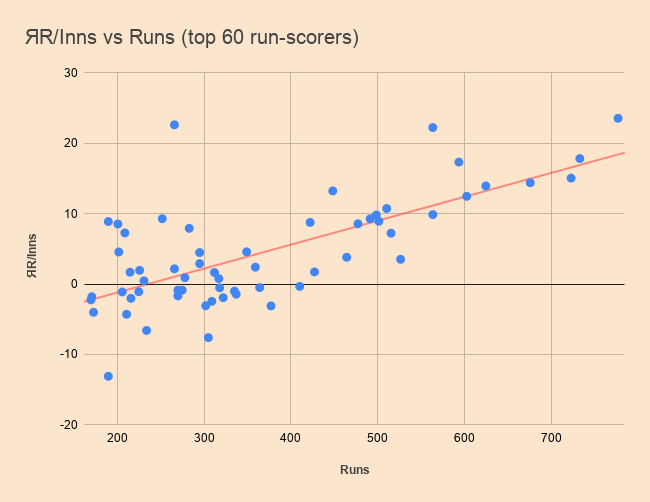
When we broaden our analysis out to the top 60 run-scorers in the competition, there are some intriguing results. The top 60 accounts for players who have scored at least 170 runs in the season. What I was expecting to find with this bigger group was most players following the trend line, with some players of slightly smaller samples generating eye-catching ЯR scores, as in 2025.
These are the guys who maybe don’t lead the way in terms of core numbers but outperformed in a smaller set of matches, either because they weren’t picked initially or got injured or fell in and out of favour. We got a nice collection of those players further down the run charts, plus one absolute outlier, as you can see in the graphic below.
The top 60 run-scorers: ЯR/Inns vs runs in the 2026 IPL season
When we broaden our analysis out to the top 60 batters, LSG’s Josh Inglis surges into second place in terms of ЯR/Inns thanks to his excellent stint of just five matches at the backend of the competition for the rock-bottom side. His ЯR/Inns of 22.62 is staggeringly good, considering he’s probably gone under the radar of most casual fans, given just how bad LSG were and out of the playoff picture for much of when he featured.
Inglis’ short run included scores of 13, 85, 36, 60 and 72 at an average of 53.20 and a SR of 186.01. His ЯR/Inns score indicates that he scored almost 23 runs more than the Par score of his side, on average, each innings.
Of course, Inglis is aided by having a smaller sample of just 5 innings. Perhaps, if he’s available from the start of the season, his numbers regress a bit. But equally, perhaps they don’t, and he’s one of the tournament’s leading batters. This is a really fun example of how this stat can highlight a player lower down the runs charts that might otherwise go a little unnoticed.
With Inglis’ teammate Marsh posting similar ЯR/Inns numbers over the season, it is worth noting how curious it is that the worst team might present 2 of the top 3 players regarding this metric. However, based on how the metric is constructed, it is also understandable, as it aims to highlight over-performance. Both Marsh and Inglis benefited, in terms of this particular metric, from being good batters in a bad team.
More specifically, it is the kind of bad that their team was that highlights them – the next two batters from LSG in terms of ЯR/Inns were Ayush Bodoni and Rishabh Pant, who notched 1.68 and 1.64, respectively. Both of those were outside the top 33 ЯR/Inns scores in the top 60 run-scorers. In that range, only LSG and DC had fewer than 3 players represented, with the former contributing their two 2 Aussies to the top 3.
The top 20 ЯR/Inns of players who scored at least 170 runs in the 2026 IPL (top 60 scorers)
It is also worth noting that Marsh was the only LSG player in the top 30 run-scorers, another illustration or explanation as to how he could be close to leading the league in ЯR/Inns from such a bad team. Considering Marsh garnered the top ЯR/Inns score in the entire competition in 2025, he and Inglis are the two batters LSG should build next season’s top order around, you’d think.
Rizvi, Rohit and Rovman: Other players of note in the top 60
If we consider this larger cohort of 60 batters, there are a few other names that pop out in terms of ЯR/Inns…
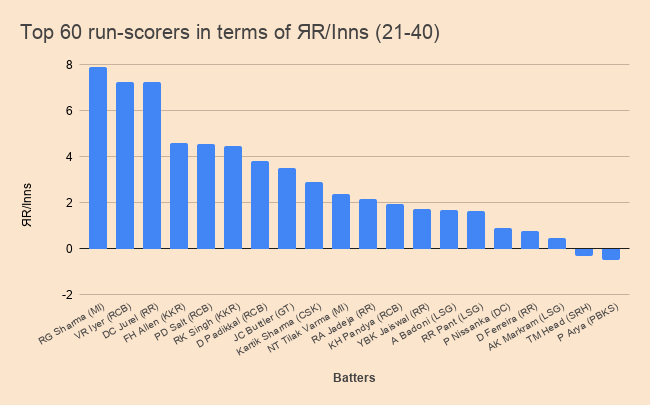
Coming in at 14th in the completion with 9 matches played is DC’s Sameer Rizvi, who notched 9.28 ЯR/Inns. Rizvi had a curious season, starting really strong with 160 runs across his first 2 outings, then added just 92 more in a further 7 innings before being phased out of the side. His dip in productivity explains why he was dropped, but it is interesting to note that he trails only KL Rahul in terms of ЯR/Inns for DC. What’s more, Pathum Nissanka (0.91) is the only other Delhi batter with a positive ЯR/Inns score inside the top 60 run-scorers.
Other players with smaller samples (sub-10 matches) that catch the eye in the top 30 ЯR/Inns scores are KKR’s Rovman Powell (8.87), CSK’s Ayush Mhatre (8.53), MI’s Rohit Sharma (7.91), as well as Venkatesh Iyer (7.26) and Phil Salt (4.56) of RCB. All of these 5 have different stories as to why they played a bit less…
Players (who scored at least 170 runs) ranked 20-41 in terms of ЯR/Inns in the 2026 IPL
Starting with the RCB pair, Salt began the season opening and played 6 matches before getting injured. Meanwhile, Venkatesh was used as an impact sub sporadically before getting a go in the opening slot after Jacob Bethell also got injured. Of Kohli’s three opening partners, Venkatesh performed the best in terms of runs and ЯR/inns, albeit in more than just one role. Considering he was thriving at the top in the finals, Venkatesh might have made the job his to lose.
Rohit Sharma just won’t go away, will he? The MI veteran was another player who suffered from injuries in the season, missing 5 straight games in the middle of the main phase. MI had a season to forget on the whole, winning just 4 matches and only finishing above LSG on net run rate. It was truly disastrous, and Rohit missing a chunk of matches only added to their chaos, with the side seemingly unable to settle on combinations. Rohit’s ЯR/Inns puts him behind only Rickleton for MI inside the top 60. Of the 4 matches they won, he played in 3.
Like MI, another of the league’s big dogs in CSK had an up-and-down campaign – starting and ending the season with three straight losses on either side of a good run of 6 wins in 8. Last season, we flagged Ayush Mhatre as having one of the better ЯR/Inns scores outside the top scorers. Mhatre ended the ’25 season with a ЯR/Inns of 12.02 from seven innings. This season he didn’t better that, but he did still rack up 8.53 from 6 matches.
While last year saw Mhatre break into the CSK side, ‘26 began with him in the XI before suffering a bad injury, which curtailed his campaign. That was a real shame because he’s now put in two good half-seasons, and next year he should surely be among their first-picked batters. Only Sanju Samson (8.56) had a better ЯR/Inns score in the side, with Kartik Sharma, another young gun, posting an encouraging 2.90 from 11 outings – the third best from CSK among the top 60 scorers.
KKR were another messy team in ’26, tinkering with their top order a lot and failing to find consistency at the front end of the season. No one from the side breached the top 16 ЯR/Inns scores among the top 60 run-scorers. CSK were the only other franchise to earn that dubious honour. We mentioned Raguvanshi already, who top-scored for KKR. However, Rovman Powell, who featured in 11 matches but only batted 7 times, pipped Raguvanshi to a higher ЯR/Inns score, with 8.87 from his innings.
Only just inside the top 60 run-getters, Powell makes a decent claim to be considered KKR’s most underrated batter from 2026 for that reason. Only 4 players from KKR in the top 60 landed positive ЯR numbers: Powell, Raguvanshi, Finn Allen (4.58) and Rinku Singh (4.47). That could (or should) be 4 of their top 6 next season, but with so many overseas players to squeeze in, it will be interesting to see if Powell gets recognised for his season just gone or gets squeezed back out of the XI as he was at the start of the 2026 season.
Personally, I’d prioritise Powell based on these numbers. Cameron Green scored negative ЯR(-1.93) but should hold his place as the allrounder and marquee man; then you could have Powell, Allen, Sunil Narine (if he’s still going) as the other overseas picks. One of the reasons Powell batted a bit less was not just being overlooked initially, but also because he is often used as a lower-order hitter, sometimes not being required if the top order does well. Another way to look at his impressive ЯR/Inns scores from 2026 could be to say that he should be elevated in the batting order ahead of the likes of Green and Rinku, who both scored more runs but relatively contributed less.
Further afield and final thoughts
Outside the top 60 run-scorers, Quinton de Kock scored 132 runs in just 3 innings, with 112 of those coming in one surprise knock. That left him on a ЯR/Inns score of 23.01, which would be the second best among the players considered, but it felt like too small a sample to include. This is an example of why the top 60 feels like a good cut-off for the core analysis – if you broaden it too widely, you end up with too many players with small samples. In fact, Josh Inglis is the only player in the top 60 scorers who played fewer than 6 matches, and even his 5 innings are on the edge of permissible.
Another interesting player outside the top 60 scorers, actually just one place outside it, is Sarfaraz Khan. Playing in the first 8 matches for CSK, Sarfaraz landed a ЯR/Inns score of 2.92 from 7 innings. That actually puts him above Kartik Sharma, who we mentioned earlier, and more intriguingly, above even his captain Ruturaj Gaikwad (-1.44) and CSK mainstay Shivam Dube (-0.87). Sarfaraz was a slightly surprising purchase by CSK in the 2025 auction and even more surprising performer in 2026, but he was, as often seems to be, the one dropped when the season was slipping away. Perhaps he’s a batter to keep an eye on next season if he can get a run of games again.
There are further players to explore and more insights to draw, but that feels like a pretty exhaustive overview and analysis of the core ЯR stats from the top batters in the 2026 IPL season. We’ve jumped from team to team, touching on the leading scorers, many talking points, and more importantly, the players whose ЯR stats tell a story that traditional batting stats cannot or do not.
Essentially, the stat is about finding hidden value or value that traditional stats cannot show. Of course, we didn’t need this tool to prove that Sooryavanshi was the star batter of the season, but perhaps we do need the stat to add colour to his performance. More pertinently, we can use ЯR to identify and quantify the value of guys like Marsh and Inglis, who did very well in a poor team; or to make selection cases for players who were dropped like Rizvi or players who were otherwise underused like Powell.
Hopefully, Relative Runs and the above analysis have shone a new light on the 2026 IPL’s best batters for you. At the end of the day, that’s the aim!
Ryan Rickleton(89.43 for his 123* vs SRH), KL Rahul (87.75 for his 152* vs PBKS), Cooper Connolly (85.56 for his 107* vs SRH), De Kock (85.29 for his 112* vs PBKS), Abhishek Sharma (76.5 for his 135* vs DC)
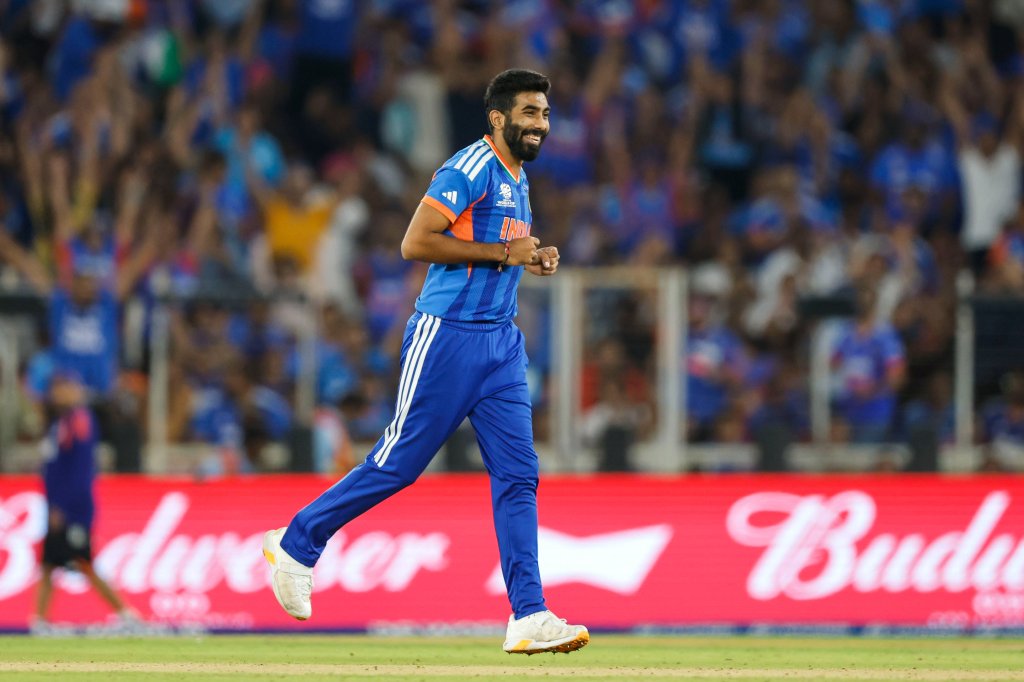
Everybody knows Jasprit Bumrah is going to go down as an all-time great. And not just in one format of the game, but all three. He’s an automatic pick in world XIs for Tests, ODIs and T20s. Recently, at the just gone T20 World Cup, he only underlined his 20-over prowess, claiming the most wickets in the tournament (14) at an average of 12.42 and a frankly astonishing economy rate of 6.21.
Those numbers in and of themselves tell a story of someone being incredibly effective in both an offensive and defensive sense, simultaneously. And therein lies the key to Bumrah’s greatness: he’s the best of both worlds in one bowler.
Now, I don’t intend to argue with that fact at all in what follows. On the contrary, I want to further explicate just how good Bumrah is by telling a little data story. And do that, I’m going to draw on one of my stats from the Relative Runs universe. Namely, Relative Economy (ЯE). But before we get to Bumrah’s numerical story at the World Cup, let me just explain the stat briefly…
What is Relative Economy?
Where Relative Runs look to quantify the relative value of a batter’s runs, and in so doing, their over- or underperformance in an innings, Relative Economy is about quantifying the relative value of a bowler’s economy rate, in relation to their peers in the innings in which their overs were bowled.
The formulation of Relative Economy is pretty simple: we take a bowler’s economy rate, and subtract from it a ‘par economy’ from that same innings. Just like how, for Relative Runs, we take a batter’s runs and subtract from it the ‘par score’ from the innings.
But what is the par economy? Well, first we need to define that. It’s going to be similar to the innings run rate, just slightly adjusted.
In the same way that for Relative Runs, we adjust the total to determine the par score by subtracting extras (as they are not runs off the bat), we are going to take off some extras from the total to determine par economy, too. But not all the extras. We will keep wides and no-ball penalties in the innings total as those two metrics are counted against a bowler’s name in their analysis, but we will remove all byes and leg byes from the total. Then we divide that new sum by the total overs bowled (in terms of legal deliveries), and we thus have the par economy (ParE).
Relative Economy (ЯE) = Classic economy rate – ParE, where ParE = (total innings runs-byes&leg byes)/overs bowled.
Here’s a quick example to illustrate that formulation in practice…
In the T20 World Cup final, Bumrah bowled four full overs that went for 15 runs (quite incredibly), giving him an economy rate of 3.75. New Zealand scored 159 runs, but five of those were byes (b4, lb1), in exactly 19 overs. That means the ParE was 154/19, or 8.1. The run rate was 8.37, so you can see the slight but important difference here. This means Bumrah’s Relative Economy for the match was -4.35 (3.75-8.1).
An aside on the way byes and leg byes are treated.
The way byes and leg byes are treated in cricket somewhat troubled me when formulating Relative Economy. In some cases, it might make sense to count byes towards a bowler’s economy because they have occurred within their overs. The historical rationale for taking them off the bowler’s count is that they are rather fielding errors. However, in some cases, especially for leg byes, there might be no obvious fielding error involved in a bye. I can return to this in more detail another time. For now, we are saying byes are excluded from Relative Economy counts, but wides and no balls are not. While all extras are taken off Relative Runs counts, as they are not scored by the batter. There’s another debate to have around whether good batters might even force wides, and should thus be ‘awarded’ those runs, if not in a scorecard sense, then in an analytical sense.
So we have our example above, but what does it mean? Well, it means that Bumrah was, on average, 4.35 runs cheaper than his teammates per over in the final. If you consider that the Par Economy was 8.1, that means he cost almost 50 per cent of the average bowler’s economy per over. And not in the whole game, but just in his team, the winning team, India! That’s a staggering stat, but also illustrative of just how good he was that night.
It wasn’t just that night, though. Let’s go through the entire tournament and see how Bumrah went, relatively, throughout the eight matches he played in…
Against Namibia, his Relative Economy was -1.27. Against Pakistan, it was 2.22. Against the Netherlands, it was -3.04. Against South Africa, it was -5.45. Against Zimbabwe, it was -2.1. Against the West Indies, it was -0.7. Against England in the semi-final, it was -3.9. And in the final, as noted above, it was -4.35.
As you can see, he was below par in every match bar one, against Pakistan. And in most cases, he was well below par economy, too. If we take the average of Bumrah’s Relative Economy across his eight matches at the World Cup, we get -2.32 (-18.59/8).
And this is where the data, via the tool of Relative Economy, tells a great story: on average across the tournament, Jasprit Bumrah costs more than two runs fewer than the average economy of his own teammates per over bowled. Or to put that another way, Bumrah’s teammates (who are also some of the best T20 bowlers in the world, mind) would go for two runs more than him per over, on average, at the World Cup.
Bumrah even better than he seems?
While a tournament economy rate of 6.21 is, in its own right, very telling as a stat, we have no idea how that economy rate fits in relatively to its cricketing ecosystem, so to speak. Was it a high-scoring tournament, and are those out-of-this-world numbers? Or was it quite a low-scoring tournament, and that is just slightly better than par?
Of course, going at around six runs per over is always going to be exceptional in a T20 match, especially at the top level, but that only explains things relative to how we perceive the par stats of the game at large, not in relation to specific matches from which those stats were gleaned, or in relation to contemporaries playining in the same conditions.
This is where the strength of relative stats shines through.
We didn’t have a readymade stat to show that a bowler outperformed (or underperformed) his peers considerably in terms of his expense… but now we do: Relative Economy. And via this tool, we are able to add a layer of nuance to the numerical story of the performance.
In the case of Bumrah at the 2026 World Cup, Relative Economy helps us to add further depth and gloss to just how good this guy was and is. So, how good was he? 2.32 runs per over cheaper than his own teammates, that’s how good! And while his classic stats are impressive enough on their own, this Relative Economy analysis might just go to show that Bumrah was even better than his numbers look at a glance.
Recently, I undertook a certificate in sports data analytics through the Irish university ATU. The certificate involved two modules – one focused on the use of statistics in an academic context and the other on machine learning models and AI. Both modules were, in different ways, equally challenging and interesting.
I made a real effort to apply some of the ideas behind Relative Runs to our assignments, most notably in the course on machine learning models. I’ve had an interest in how things like regression models can be applied to cricket since seeing them mentioned in a couple of great books (Cricket 2.0 and Hitting Against the Spin, to my recollection). When we got onto how to build and analyse machine learning models, I couldn’t wait to play with them using Relative Runs.
I focused mostly on what are called logistic regression models, which, perhaps counterintuitively, are not a type of regression model, but rather a kind of classification model. What that means is that these models work by using input data to predict a binary output, rather than a continuous numerical output (which is broadly what regression models do). In short, these models are using input data to predict one of two classes, hence the name ‘classification model’. These two classes can be any variety of binary feature, from wins and losses to an injury occurrence or non-occurrence.
In the case of my model, I wanted to look at how Relative Runs could be used to predict overall performance success. What I had was my analysis of the 2025 IPL season, including Relative Runs scores for all the top batsmen across that season. What I wanted to pair that with was some kind of binary output feature that I could double as an indicator of overall tournament success. This is tricky conceptually because we are starting with a player metric, and we want to know whether this input feature bears some relationship with an output team metric.
At first, I was not optimistic that this route would be anything other than an interesting academic exercise. It proved more than that, however!
I chose as my output variable the binary feature of whether a player’s team made the playoffs or not. That is, whether or not that player’s team finished in the top 4 or bottom 6 at the end of the regular season. In essence, the idea here was to say, rather than splitting the table in half, let’s split it into post-season entry or not. Most IPL franchises would deem making the playoffs as a key indicator of success, and in many ways, that is what they are buying when they build teams – they are paying to make the playoffs (and then hopefully win it all). If there is some underlying relationship between a stat like Relative Runs and team performance, making the playoffs is a good metric to start with in terms of testing that relationship out.
So I had my output variable: making the playoffs or not. What I wanted to know next was whether there is a meaningful predictive relationship between certain input player metrics and that output variable. As input variables, I chose to focus on runs, strike rate, and Relative Runs per Innings. I ran logistic regression models to ascertain which of those inputs generated the best models in terms of predicting teams’ success, as measured by making the playoffs. And what’s more, I also tested combinations of those input variables with the same output target. The results were more interesting than I expected!
First, regarding the tests with one player metric as input, the model with runs as the only input variable performed worst in terms of predictive accuracy, followed by strike rate, then by Relative Runs per innings. What this means, in short, is that according to the dataset used (which, granted, was only using the top 50 batters in the 2025 IPL), Relative Runs per Innings was the best predictor of team success of those three individual metrics, when using logistic regression. The model accuracy was only 0.67, and the precision was 0.5, which isn’t great, but it was the best of the three, which pleasantly surprised me.
Combining the input variables was even more fascinating. You’d think more input variables mean more accuracy in the models, and that’s broadly what I found to be true.
I ran models that used Relative Runs per Innings + strike rate, Relative Runs per Innings + runs, and lastly, all three together. The worst of those was Relative Runs per Innings + strike rate, while the other two generated the same key evaluation scores, so I put them both through what’s called a ‘k-fold cross validation’, which runs the model ‘k times’ using different slices of data. That extra step showed that the model using runs and Relative Runs per Innings was more accurate than the model which used all three input variables, curiously. This could be proof that the strike rate actually created noise in the model, as including it hindered accuracy.
The mean accuracy of the best model was 0.7. What does this mean? In short, it means that the model, which used Relative Runs per Innings and runs as inputs, correctly predicted the output of making the playoffs or not 70% of the time. That’s not an astronomical result, but what is really encouraging from these models is that it gives proof that Relative Runs improved the accuracy of the models in terms of predictive success, and actually bore a stronger relationship with team success than both players’ runs and strike rate did on their own.
Of course, it should be remembered that this is all based on one rather small dataset, but still, that is a fascinating result and a good indication of how Relative Runs could be used going forward. If the stat bears a strong relationship with team success, it could be a very useful tool for talent identification. Going big picture, we often scan the run charts and strike rates of batsmen in tournaments to find ‘the best’ players… But perhaps Relative Runs is a better starting point for these conversations than either of those traditional stats. Bigger datasets and more nuanced models will add depth to that conversation.
I also dipped into regression models using the same three inputs, but with the output variable of the teams’ final rankings in the season, from 1 to 10. These regressions were interesting, but pretty much every combination of inputs resulted in fairly inaccurate models. That was probably down to the fact that using rank as a target output was not a great choice, and I’d try the whole process again with a finer-grained metric, such as win percentage. That is, I’d like to discover whether there is a good model to be made out of the relationship between Relative Runs and runs as inputs, and players’ win percentages as outputs.
Broadly speaking, the logistic regression analyses worked a lot better, but there’s room to do a lot more regression analyses. Indeed, there’s room to do a lot more research with both types of models using much larger datasets, and utilising more varieties of the Relative Runs universe: that is, Relative Strike Rate, Relative Economy.
Another cool component of the certificate I completed was learning how to use Power BI to create reports and dashboards. If you have a Power BI account, you can take a look via this link at a report I built to display the batting stats of the top 49 batters from the 2025 IPL season, including Relative Runs and Relative Runs per Innings.
The 2025 IPL season is behind us and so it’s time to take a look at an analysis of the best batters at the tournament using Relative Runs (RR).
But why? Well, what RR allows us to do is find hidden or overlooked value that traditional stats don’t otherwise reveal. In the case of this tournament, or any long competition, RR is very useful. That’s because traditional, (let’s say non-relative or ‘absolute’) statistics face some philosophical issue. Namely, the value of runs across matches is not consistent. The longer the tournament and the more diverse the conditions, the more this is a factor.
Let’s flesh that last point out a bit. It’s trivially true that scoring 50 runs in a T20 match in which the total is 250, means less than in a total of 150. This is where the power of RR lies; it gives us a measure of the contribution of a batting score relative to the innings that it exists within. Not only that, RR provides a neat and tidy numerical reading that is easy to digest.
Because RR is zero-sum – that is, the combined RR scores of an innings add to zero – the stat has an intuitive resonance. An RR score of 0 is exactly par, anything above or below demonstrates the runs that a player scores over/under, respectively, the expected score or mean (in our case, the ‘Par’) of an innings.
This brief rationale for RR holds for all cricket matches but in the case of the IPL, a long tournament in which innings totals range from 120 to 250, RR is particularly useful for analysing the contribution of players across the entire season.
As with any stat, RR is not the perfect measure of absolutely everything, but in the following discussion, we will point out its strengths and weaknesses in terms of providing pertinent analysis.
For example, RR is a stat that looks at runs and not strike rates (more on our related Relative Strike Rate (RSR) another time). In the case of lower order ‘finishers’ in T20 cricket, RR might be less interesting than RSR, in the same way that we tend not to talk about averages with finishers in favour of looking at their strike rates.
Let’s start with a bit of context for the forthcoming analysis: We are going to be mainly looking at the best batters in the tournament.
It’s a huge tournament of just over 70 games with more than 200 players taking part so this analysis will not be exhaustively looking at every single innings batted, but rather honing in on the top performing batters and using RR to evaluate their contributions.
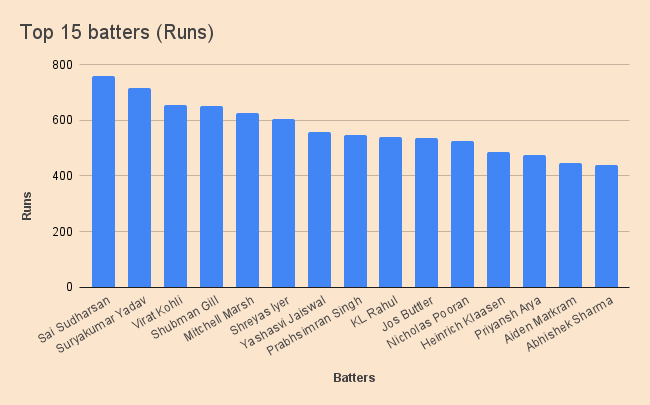
But who were the top batsmen? Well, we’re going to focus on the top 50-60 run scorers in what follows. Without detailing who they all are here (here’s a full list that you can peruse), below are the top 15 in order of runs scored at the tournament with runs, averages and strike rates listed. These are, fairly uncontroversially, the main batting stats used in everyday parlance. Hopefully soon, RR (or RR/Inns) is added to that list one day.
This is an interesting list for sure but the top of the chart is naturally going to be weighted towards those who batted more. That is, those who didn’t get injured and/or went deeper in the tournament. Total runs (and by extension the ‘Orange Cap’ winner) also faces this quite obvious objection as a good measure of the best batters.
Really, our key measure of value should be RR per innings (RR/Inns), which answers the question of how much each player contributed relatively per outing. So, let’s have a look at that list.
The top 15 RR/Inns scorers
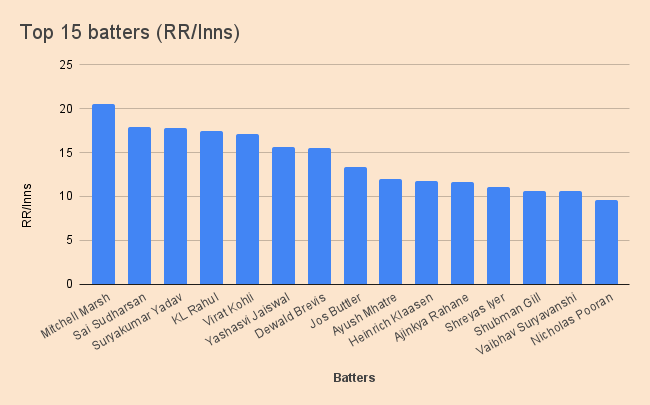
In terms of RR/Inns, the top 15 looked liked this:
As you can see, the 15th player is the first to drop below a RR/Inns score of 10. That means, the top 14 all contributed at least 10 runs more than the mean of the innings they batted in, on average.
That feels like not just a nice round number to cordon off a top group, but a fair measure of an elite contribution. So, let’s consider this top 14 the elite batters according to RR in the IPL. These were the guys who did significantly better than their own teammates, game in, game out, over the season; granted, some this list only played half the matches of the group stage.
The next group would be those who notched 5-10 RR/Inns, and then 0-5. Batters who are in the negative in terms of RR/Inns have, as intuition would suggest, scored less than Par, or less than excepted.
In some cases, such as he case of finishers, this isn’t necessarily problematic (as mentioned above, other stats are arguably better to evaluate finishers) but for top-order (even most middle order) batters, being in the negative in terms of RR/Inns marks a batter as ‘below par’.
Lucknow captain Rishabh Pant is a good example of a below-par batter in the top 50 total scorers. He had a pretty poor season, aside from one terrific ton in his last game. Pant scored 269 runs but his RR/Inns was -5.80. Meaning that he averaged almost 6 runs less than his side’s Par score in each innings.
If we exclude his last innings (the third best RR score in an innings in the entire IPL season), Pant’s RR/Inns was way down at -12.57. This is really nice indication of just how poor his output was and a figure that is, arguably, more instructive than his 269 runs at an average of 24.45 and strike rate of 133.16. Although, those numbers aren’t pretty reading, either.
Marsh in a league of his own
Putting Pant aside, what can we learn from this data at a glance about the best batters?
Well, what immediately stands out is how Mitch Marsh comes to the top of the pile in terms of RR per innings. What this means is that his relative contribution to his team was the greatest of any batter in the tournament. He didn’t top any charts or win any of the official awards or even make many notable Teams of the Tournament but, by this metric, he was the best batter in the 2025 IPL.
Other standout players include the top run scorers (Sudharsan, SKY & Kohli) and, more interestingly, KL Rahul. These five (including Marsh) were the only batters to score over 17 RR/Inns. Marsh is in a league of his own, though, at 20.54.
Many of the leading run scorers get into this top group (the top 15 of RR/Inns), which is expected as it follows that high run scorers are going to have high RR scores, but it’s not a 1:1 correlation.
Look at the difference between Shubman Gill and his top scoring peers, his RR per innings is pretty low comparatively (10.62) despite being the fourth highest run scorer in the league. Surely, he was hampered by Sudharsan’s relatively greater success. That is, Sudharasan’s incredible season drags Gill’s numbers down a bit, in terms of RR.
The rising stars
Coming in at the bottom of the top 10 in terms of RR/Inns is one of the more interesting players in this analysis and that’s Dewalt Brevis.He came into the CSK lineup only for the latter half of the tournament and really impressed. So much so that his RR/Inns is one of the highest across the board, albeit derived from fewer innings than much of his competition.
The same can be said of Brevis’ teammate Ayush Mhatre (12.02 RR/Inns) and 14-year-old Rajasthan sensation Vaibhav Suryavanshi (10.59/Inns). These three rising stars exploded in the second half of the tournament and one can only wonder what their stats would look like had they played the full league phase. Presumably, we’ll find out next season.
The top 60 run scorers
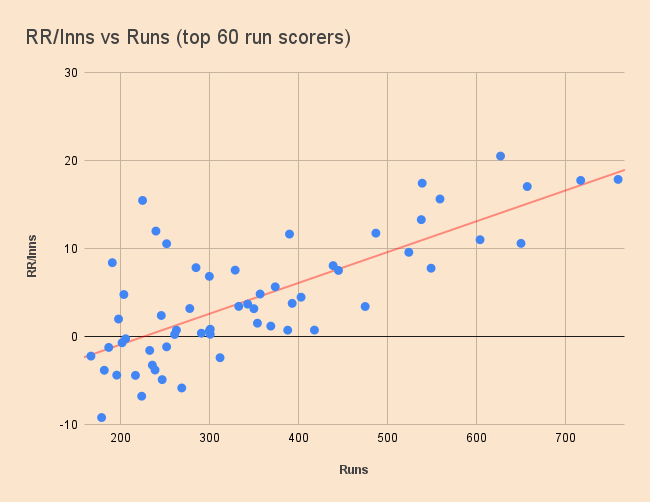
Growing it out to the top 60 run scorers, there are some key trends. As expected, RR tracks with runs scored largely but not entirely. If they correlated exactly, it wouldn’t be a particularly interesting stat.
As you can see in the chart above (RR/Inns vs runs), many batters loosely follow the trend line but some exist well above or below that line. These are the players that become of interest. Clearly, being well above the line suggests significant over-performance, and vice versa for being below it.
You can see Marsh, Rahul et al. in the top right quadrant, mostly following the trend line. On the left of the chart, there is a cluster of positive outliers – Brevis, Rahane, Suryavashi and Mhatre. These guys are the lower-scoring over-performers, you could say.
One player that is also interesting in this sense is CSK’s Rachin Ravindra. The Kiwi scored an uninspiring 191 runs (average 27.28, strike rate 128.18) but his RR/Inns score was 8.43. That is the 16th best RR/Inns in the season. However, his core stats tell a fuller story.
The Kiwi was dropped midway through the season – essentially replaced by Mhatre/Devon Conway – due to his poor strike rate. So, while his RR/Inns was pretty impressive, there were other factors for his exclusion from the side. Also, being an overseas player, he is more prone to being dropped for such under-performance. Or rather, once he was out, it was impossible for him to get back in.
This is an interesting case study of when RR does not tell the whole story, or might tell the wrong story. Another way of looking at this could be to say that perhaps Ravindra was a little unlucky to be completely excluded from the side and might be a good pickup for another franchise in the next auction, assuming CSK don’t retain him.
Good, great and amazing
Looking at the chart, the top 60 batters cluster into groups – those who scored over 500 runs, between 300 and 500, and under 300. Think of this as your run scorers being in an exceptional group, above average and decent. 300 runs is about the point where batters all go into the positive in terms of RR/Inns, hence the use of ‘above average’.
In the elite group, it’s worth noting, having a slightly lower RR/Inns than the trend isn’t necessarily the worst thing. It can be a product of the specifics of the team in which the player exists.
For example, the Gujarat top three (Sudharsan, Gill, Buttler) were a pretty special case this season. They all scored very heavily, remarkably so. Rarely, if ever, has an IPL side relied so much on the sustained output of a top three. What their incredible form did was lower the RR potential for each of them as none could become a huge outlier in the side. All of this adds depth to how we should read the results above.
Sudharsan’s season was worthy of his accolades, it’s just that, according to RR, Marsh was more valuable. It’s a moot point, but it could be argued that RR shows that Marsh would have scored more for GT than Sudharsan did (if the players swapped sides), but we’d never know. I’m sure, real runs are more important than theoretical ones to many readers.
Another point related to GT is that, just as Sudharsan was less relatively impressive than Marsh in virtue of being in a better team, Gill and Buttler were also significantly affected in terms of their RR potential by Sudharsan’s incredible season.
Just as we could argue Marsh wouldscore more than Sudharsan if he were at GT, one could equally argue that Gill’s objectively impressive 650 runs would have generated a higher RR score if he were in a poorer side (for example, in Marsh’s Lucknow). They would have counted for more RR in a lower scoring side but again, we’ll never know how he’d have performed in a different team context and in different match conditions.
What we do know, though, is who wins our batting awards based on Relative Runs!