Relative Runs: A new way of looking at cricket statistics

  • 2025 IPL Batting Analysis

    The 2025 IPL season is behind us and so it’s time to take a look at an analysis of the best batters at the tournament using Relative Runs (RR).

    But why? Well, what RR allows us to do is find hidden or overlooked value that traditional stats don’t otherwise reveal. In the case of this tournament, or any long competition, RR is very useful. That’s because traditional, (let’s say non-relative or ‘absolute’) statistics face some philosophical issue. Namely, the value of runs across matches is not consistent. The longer the tournament and the more diverse the conditions, the more this is a factor.

    Let’s flesh that last point out a bit. It’s trivially true that scoring 50 runs in a T20 match in which the total is 250, means less than in a total of 150. This is where the power of RR lies; it gives us a measure of the contribution of a batting score relative to the innings that it exists within. Not only that, RR provides a neat and tidy numerical reading that is easy to digest.

    Because RR is zero-sum – that is, the combined RR scores of an innings add to zero – the stat has an intuitive resonance. An RR score of 0 is exactly par, anything above or below demonstrates the runs that a player scores over/under, respectively, the expected score or mean (in our case, the ‘Par’) of an innings.

    This brief rationale for RR holds for all cricket matches but in the case of the IPL, a long tournament in which innings totals range from 120 to 250, RR is particularly useful for analysing the contribution of players across the entire season.

    As with any stat, RR is not the perfect measure of absolutely everything, but in the following discussion, we will point out its strengths and weaknesses in terms of providing pertinent analysis.

    For example, RR is a stat that looks at runs and not strike rates (more on our related Relative Strike Rate (RSR) another time). In the case of lower order ‘finishers’ in T20 cricket, RR might be less interesting than RSR, in the same way that we tend not to talk about averages with finishers in favour of looking at their strike rates.

    That’s probably enough preamble and justification, so let’s get into the findings – if you’re curious or need a refresher, you can read more about the formulation of Relative Runs here


    The best batters in the 2025 IPL 

    Let’s start with a bit of context for the forthcoming analysis: We are going to be mainly looking at the best batters in the tournament. 

    It’s a huge tournament of just over 70 games with more than 200 players taking part so this analysis will not be exhaustively looking at every single innings batted, but rather honing in on the top performing batters and using RR to evaluate their contributions.

    But who were the top batsmen? Well, we’re going to focus on the top 50-60 run scorers in what follows. Without detailing who they all are here (here’s a full list that you can peruse), below are the top 15 in order of runs scored at the tournament with runs, averages and strike rates listed. These are, fairly uncontroversially, the main batting stats used in everyday parlance. Hopefully soon, RR (or RR/Inns) is added to that list one day.

    The top 15 run scorers

    Sai Sudharsan (759; 54.21; 156.17), Suryakumar Yadav, (717; 65.18; 167.91), Virat Kohli (657; 54.74; 144.71), Shubman Gill (650; 50.00; 155.87), Mitchell Marsh (627; 48.23; 163.70), Shreyas Iyer (604; 50.33; 175.07), Yashasvi Jaiswal (559; 43.00; 159.71), Prabhsimran Singh (549; 32.29; 160.52), KL Rahul (539; 53.90; 149.72), Jos Buttler (538; 59.77; 163.03), Nicholas Pooran (524; 43.66; 196.25), Heinrich Klaasen (487; 44.27; 172.69), Priyansh Arya (475, 27.94, 179.24), Aiden Markram (445; 34.23; 148.82), Abhishek Sharma (439; 33.76; 193.39).

    The top 15 Relative Runs scorers

    In terms of total RR scored, the top 15 looked liked this:

    Suryakumar Yadav (284.45), Sai Sudharsan (268.38), Mitchell Marsh (267.05), Virat Kohli (256.23), KL Rahul (227.01), Yashasvi Jaiswal (219.34), Shreyas Iyer (187.64), Jos Buttler (173.13), Shubman Gill (159.38), Heinrich Klaasen (153.23), Ajinkya Rahane (140.16), Nicholas Pooran (134.55), Prabhsimran Singh (132.64), Abhishek Sharma (105.23), Aiden Markram (98.15).

    This is an interesting list for sure but the top of the chart is naturally going to be weighted towards those who batted more. That is, those who didn’t get injured and/or went deeper in the tournament. Total runs (and by extension the ‘Orange Cap’ winner) also faces this quite obvious objection as a good measure of the best batters.

    Really, our key measure of value should be RR per innings (RR/Inns), which answers the question of how much each player contributed relatively per outing. So, let’s have a look at that list.

    The top 15 RR/Inns scorers

    In terms of RR/Inns, the top 15 looked liked this:

    Mitchell Marsh (20.54), Sai Sudharsan (17.89), Suryakumar Yadav (17.78), KL Rahul (17.46), Virat Kohli (17.08), Yashasvi Jaiswal (15.67), Dewalt Brevis (15.50), Jos Buttler (13.32), Ayush Mhatre (12.02), Heinrich Klaasen (11.79), Ajiknkya Rahane (11.68), Shreyas Iyer (11.04), Shubman Gill (10.62), Vaibhav Suryavanshi (10.59), Nicholas Pooran (9.61).

    As you can see, the 15th player is the first to drop below a RR/Inns score of 10. That means, the top 14 all contributed at least 10 runs more than the mean of the innings they batted in, on average.

    That feels like not just a nice round number to cordon off a top group, but a fair measure of an elite contribution. So, let’s consider this top 14 the elite batters according to RR in the IPL. These were the guys who did significantly better than their own teammates, game in, game out, over the season; granted, some this list only played half the matches of the group stage.

    The next group would be those who notched 5-10 RR/Inns, and then 0-5. Batters who are in the negative in terms of RR/Inns have, as intuition would suggest, scored less than Par, or less than excepted.

    In some cases, such as he case of finishers, this isn’t necessarily problematic (as mentioned above, other stats are arguably better to evaluate finishers) but for top-order (even most middle order) batters, being in the negative in terms of RR/Inns marks a batter as ‘below par’.

    Lucknow captain Rishabh Pant is a good example of a below-par batter in the top 50 total scorers. He had a pretty poor season, aside from one terrific ton in his last game. Pant scored 269 runs but his RR/Inns was -5.80. Meaning that he averaged almost 6 runs less than his side’s Par score in each innings.

    If we exclude his last innings (the third best RR score in an innings in the entire IPL season), Pant’s RR/Inns was way down at -12.57. This is really nice indication of just how poor his output was and a figure that is, arguably, more instructive than his 269 runs at an average of 24.45 and strike rate of 133.16. Although, those numbers aren’t pretty reading, either.

    Marsh in a league of his own

    Putting Pant aside, what can we learn from this data at a glance about the best batters?

    Well, what immediately stands out is how Mitch Marsh comes to the top of the pile in terms of RR per innings. What this means is that his relative contribution to his team was the greatest of any batter in the tournament. He didn’t top any charts or win any of the official awards or even make many notable Teams of the Tournament but, by this metric, he was the best batter in the 2025 IPL.

    Other standout players include the top run scorers (Sudharsan, SKY & Kohli) and, more interestingly, KL Rahul. These five (including Marsh) were the only batters to score over 17 RR/Inns. Marsh is in a league of his own, though, at 20.54.

    Many of the leading run scorers get into this top group (the top 15 of RR/Inns), which is expected as it follows that high run scorers are going to have high RR scores, but it’s not a 1:1 correlation.

    Look at the difference between Shubman Gill and his top scoring peers, his RR per innings is pretty low comparatively (10.62) despite being the fourth highest run scorer in the league. Surely, he was hampered by Sudharsan’s relatively greater success. That is, Sudharasan’s incredible season drags Gill’s numbers down a bit, in terms of RR.

    The rising stars

    Coming in at the bottom of the top 10 in terms of RR/Inns is one of the more interesting players in this analysis and that’s Dewalt Brevis. He came into the CSK lineup only for the latter half of the tournament and really impressed. So much so that his RR/Inns is one of the highest across the board, albeit derived from fewer innings than much of his competition.

    The same can be said of Brevis’ teammate Ayush Mhatre (12.02 RR/Inns) and 14-year-old Rajasthan sensation Vaibhav Suryavanshi (10.59/Inns). These three rising stars exploded in the second half of the tournament and one can only wonder what their stats would look like had they played the full league phase. Presumably, we’ll find out next season.

    The top 60 run scorers

    Growing it out to the top 60 run scorers, there are some key trends. As expected, RR tracks with runs scored largely but not entirely. If they correlated exactly, it wouldn’t be a particularly interesting stat.

    As you can see in the chart above (RR/Inns vs runs), many batters loosely follow the trend line but some exist well above or below that line. These are the players that become of interest. Clearly, being well above the line suggests significant over-performance, and vice versa for being below it.

    You can see Marsh, Rahul et al. in the top right quadrant, mostly following the trend line. On the left of the chart, there is a cluster of positive outliers – Brevis, Rahane, Suryavashi and Mhatre. These guys are the lower-scoring over-performers, you could say.

    One player that is also interesting in this sense is CSK’s Rachin Ravindra. The Kiwi scored an uninspiring 191 runs (average 27.28, strike rate 128.18) but his RR/Inns score was 8.43. That is the 16th best RR/Inns in the season. However, his core stats tell a fuller story.

    The Kiwi was dropped midway through the season – essentially replaced by Mhatre/Devon Conway – due to his poor strike rate. So, while his RR/Inns was pretty impressive, there were other factors for his exclusion from the side. Also, being an overseas player, he is more prone to being dropped for such under-performance. Or rather, once he was out, it was impossible for him to get back in.

    This is an interesting case study of when RR does not tell the whole story, or might tell the wrong story. Another way of looking at this could be to say that perhaps Ravindra was a little unlucky to be completely excluded from the side and might be a good pickup for another franchise in the next auction, assuming CSK don’t retain him.

    Good, great and amazing

    Looking at the chart, the top 60 batters cluster into groups – those who scored over 500 runs, between 300 and 500, and under 300. Think of this as your run scorers being in an exceptional group, above average and decent. 300 runs is about the point where batters all go into the positive in terms of RR/Inns, hence the use of ‘above average’.

    In the elite group, it’s worth noting, having a slightly lower RR/Inns than the trend isn’t necessarily the worst thing. It can be a product of the specifics of the team in which the player exists.

    For example, the Gujarat top three (Sudharsan, Gill, Buttler) were a pretty special case this season. They all scored very heavily, remarkably so. Rarely, if ever, has an IPL side relied so much on the sustained output of a top three. What their incredible form did was lower the RR potential for each of them as none could become a huge outlier in the side. All of this adds depth to how we should read the results above.

    Sudharsan’s season was worthy of his accolades, it’s just that, according to RR, Marsh was more valuable. It’s a moot point, but it could be argued that RR shows that Marsh would have scored more for GT than Sudharsan did (if the players swapped sides), but we’d never know. I’m sure, real runs are more important than theoretical ones to many readers.

    Another point related to GT is that, just as Sudharsan was less relatively impressive than Marsh in virtue of being in a better team, Gill and Buttler were also significantly affected in terms of their RR potential by Sudharsan’s incredible season.

    Just as we could argue Marsh would score more than Sudharsan if he were at GT, one could equally argue that Gill’s objectively impressive 650 runs would have generated a higher RR score if he were in a poorer side (for example, in Marsh’s Lucknow). They would have counted for more RR in a lower scoring side but again, we’ll never know how he’d have performed in a different team context and in different match conditions.

    What we do know, though, is who wins our batting awards based on Relative Runs!

    Relative Runs batting awards for the 2025 IPL

    Most Relative Runs:

    1st: Suryakumar Yadav (284.45)
    2nd: Sai Sudharsan (268.38)
    3rd: Mitchell Marsh (267.05)

    Most RR/Inns:

    1st: Mitchell Marsh (20.54)
    2nd: Sai Sudharsan (17.89)
    3rd: Suryakumar Yadav (17.78)

    Most RR in an innings:

    1st: Abhishek Sharma (81.75 for his 141 vs Punjab Kings)
    2nd: Priyansh Arya (76.5 for his 103 vs CSK)
    3rd: Rishabh Pant (75.4 for his 118 vs RCB)

  • 2025 Champions Trophy Analysis

    The 2025 Champions Trophy (CT) in Pakistan/UAE has come and gone, so let’s take a look at the best batters and bowlers from the tournament using Relative Runs (RR) and the associated stat of Relative Economy (REc).

    A few things jump out about the CT just glancing at the tournament. In Lahore and Karachi, a par score was around 320, while over in Dubai, where India played all their matches, 260 was enough to win all but one match. Just those facts alone play into the hands of Relative Runs as a tool.

    Obviously, the value of runs is different at each of those venues, not to mention Rawalpindi. Trivially, scoring 50 means more in a total of 250 than in a total of 350. Equally, a bowler going at 6 runs an over in an innings over 320, could be considered fine or even pretty good. While, going at 6 runs an over in an innings of 250 or lower is objectively expensive.

    Another curiosity of the tournament was that not all sides played all 3 groups games. Cancellations and tournament progression mean that leaderboards are skewed – i.e. having the most runs or wickets is less valuable if you’ve played more matches. Of course, this is where we can draw on averages, but also, this gives us another reason to pick out some RR and REc analyses to find alternative forms of value in the stats.

    So let’s take a close look at the best batters and bowlers throughout the competition and use our stats to rank them. Further on, we will present a team of the tournament based on the stats discussed. Who’s going to make it?

    Batting Analysis

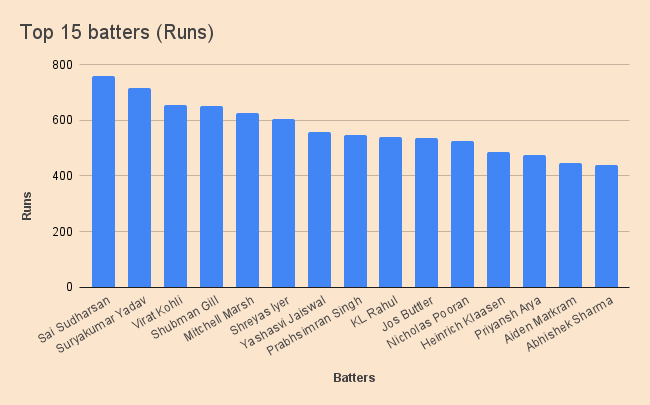
    The top 9 batters at the CT, in order of runs scored, were: Rachin Ravindra (263), Shreyas Iyer (243), Ben Duckett (227), Joe Root (225), Virat Kohli (218), Ibrahim Zadran (216), Tom Latham (205) and Kane Williamson (200).

    These are the only batters who scored over 200 runs in the competition. Ravindra was named the official player of the tournament, and fairly so, thanks to his two centuries on New Zealand’s way to the final.

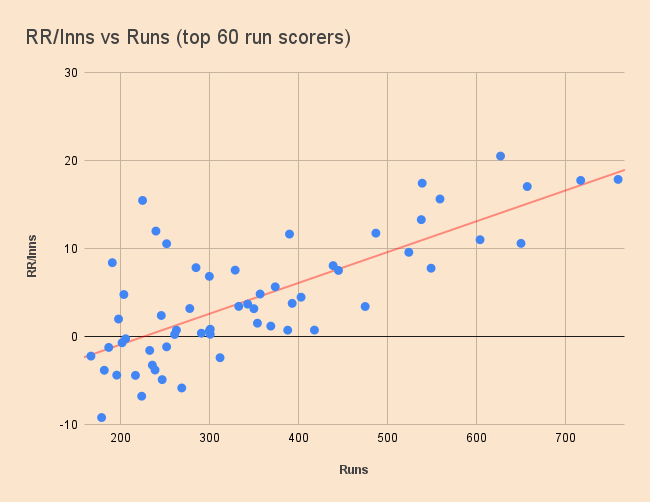
    When we look at Relative Runs, however, the leaderboard is a bit different. The top RR scorers across the tournament were: Duckett (151.83), Root (149.84), Ravindra (141.95), Zadran (139.76) and Rassie van der Dussen (93.52).

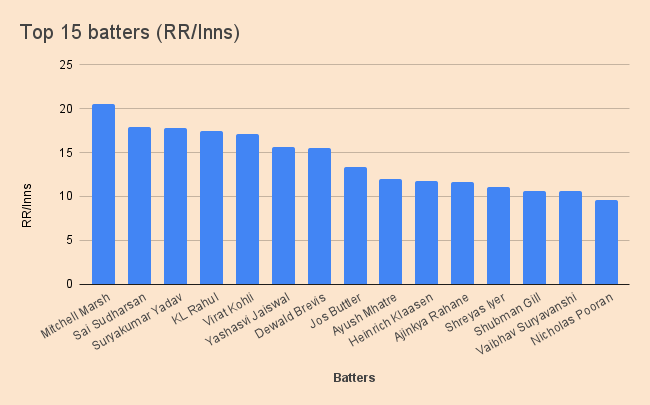
    When we take into account innings batted, the top RR scorers per innings were: Duckett(50.61), Root (49.94), Zadran (46.58), Jaker Ali (36.54), Ravindra (35.49), Towhid Hridoy (33.54), and then Van der Dussen (31.17).

    These 7 batters were the only ones to average more than 30 RR per innings. This means, they would typically score more than 30 runs more than the par score of their teammates. That’s a significant contribution. However, only two of those made the official team of the tournament: Ravindra and Zadran, as the chosen openers.

    My first argument using RR here is that Duckett and Root are both very unlucky not to be in the team of the tournament despite the fact England lost all three of their matches.

    Both of them were in the top 4 run-scorers, had higher averages than Ravindra and Zadran, both scored centuries, and importantly for us, they were the leading RR scorers in total and per innings. For these compelling reasons, I’m calling them the two best batters of the tournament.

    There are a couple other points to make here. The Bangladeshi duo of Jaker and Hridoy stick out. I would not have thought of them as standout players but they were according to RR. Partly this is informed by the fact they were in a largely failing side – good players in bad teams will stand out according to RR due to the relative nature of how the stat is formulated.

    They put on a massive sixth-wicket partnership of 154 against India when the rest of their side crumbled, one of the forgotten highlights of the tournaments that RR helps us to value.

    The same points holds true of Duckett and Root – they outperformed their teammates so much that they have great RR stats. In the case of these two, though, their overall stats also hold up against all the batters in the tournament, impressively.

    Bangladesh only played two matches, like Pakistan (due to the sides’ washout), it should also be noted. If we set a parameter for batters who batted a minimum of 3 times (which is reasonable), the top RR per innings players were: Duckett, Root, Ravindra, Van der Dussen (all as above), then: Azmatullah Omarzai (16.58), Ryan Rickelton (15.84), Iyer (15.70), Kohli (10.70), and then sub-10 value batters.

    There are a few more honourable mentions to make to players who only batted twice but performed well according to RR per innings, that is, better than Azmatullah but worse than Van der Dussen. Those are: Khushdil Shah (29.55), Josh Inglis (29.39), Alex Carey (28.89), Temba Bavuma (24.26) and Babar Azam (19.54).

    There’s a conversation to be had about whether playing more matches in the tournament means you should be considered higher or lower. Playing more can mean you have more chances to improved your stats, but also more chances to lower your average via outs.

    Generally, when it comes to something like awards, you want to favour players who went deep in the competition or on to win the thing. I’m going to put that consideration to one side (or rather leave it to the ICC) and present the following based on all of the above:

    Batting Awards

    Most RR: Ben Duckett (151.84)

    Most RR per innings: Ben Duckett (50.61)

    Most RR in an innings: Ibrahim Zadran (142.11) vs England

    Bowling Analysis

    Let’s move over to the bowlers now. The focus of this analysis isn’t going to be wickets – although they play a part in assessing bowlers, obviously – but rather, Relative Economy (REc).

    This is our key stat in white-ball cricket because keeping teams to lower totals is more crucially than taking many wickets. To win a Test match, you much take 20 wickets; to win a limited-overs match, you needn’t take 10. In fact, you needn’t take any – although that would be very odd. What we’re saying is, though, REc is our most essential stats for assessing bowlers and we will couple that with wicket taking ability in the conversation that follows.

    The top bowlers in the tournament according to wickets taken were: Matt Henry (10), Mitchell Santner (9), Mohammed Shami (9), Varun Chakravarthy (9), Michael Bracewell (8), Azmatullah (7), Ben Dwarshuis (7), Kuldeep Yadav (7) and then a lot who took 6 or fewer.

    The bowling averages from those players above were (in order): Varun (15.11 – best in the CT), Henry (16.70), Azmatullah (20), Dwarshuis (21.71), Bracewell (25.12), Shami (25.88), Santner (26.66), Kuldeep (31.85).

    The official team of the tournament had a bowling attack of: Henry, Shami, Azmatullah, Varun and Santner, with Ravindra in the top order as an allrounder.

    It’s hard to argue too much with that attack – it’s balanced and they all had very good tournaments. But can we find any hidden or extra value using REc? Let’s take a look and see.

    According to total REc accumulated (having bowled 10 overs or more in the CT), the best bowlers in the tournament were: Bracewell (-5.89), Abrar Ahmed (-4.64), Mohammad Nabi (-4.6), Adil Rashid (-4.21), Santner (-2.61), Ravindra (-2.54), Axar Patel (-2.43), Taskin Ahmed (-2.15), Keshav Maharaj (-2.08), Nathan Ellis (-2.02). Ravindra Jadeja (-1.97), Noor Ahmad (-1.74), Harshit Rana (-1.49), Wiaan Mulder (-1.28), Varun (-1,25), Naseem Shah (-1.22), and Mehidy Hasan Miraz (-1.15).

    All of the above bowlers accumulated more than -1 REc throughout the tournament.  Notable bowlers who join this group and bowled less than 10 overs include Matthew Short (-2.48) and  Salman Ali Agha (-2.14). This indicates they were underused by their teams.

    If we average it out for overs, the best REc per overs bowlers were: Firstly, Short and Salman – again, underused outliers – and then of those who bowled 10 overs or more, in order: Abrar (-0.43), Nabi (-0.31), Rashid (-0.16), Taskin (-0.13), Ravindra (-0.12), Bracewell (-0.12), Harshit (-0.10), Noor (-0.08), Maharaj (-0.07), Ellis (-0.07), Mulder (-0.06), Axar (-0,05), Santner (-0,05), Jadeja (-0.05), Varun (-0.04).

    A few things stand out when we look at these top 15 bowlers according to REc per overs bowled. Firstly, most of them are slow blowers, which isn’t hugely surprisingly. Spinners tend to have better economy rates in 50-over cricket as they are used outside the power play and in the slower middle overs heavily. But perhaps more strikingly, the top 4 bowlers are all from sides that were dumped out before the semi-finals.

    Just like with good batters in weak teams, economical bowlers in poor teams will standout more with these stats. Rashid is a good example, he’s an outstanding bowling in a losing side that was full of relatively expensive pace bowlers, that is, England. His REc is thus very low. Despite that caveat, his numbers are still impressive.

    Another curiosity is how well Harshit Rana performed for India despite later being dropped from the team for the final matches of the tournament in favour of Varun. He was actually the second best pace bowler in the entire competition accruing to REc, albeit having only played two matches.

    If we were to pick a bowling attacking from these numbers, including at least two pace bowlers, it would be: Taskin, Harshit, Abrar, Nabi, Rashid with Ravindra chipping in as an allrounder.

    Interestingly, Ravindra makes both the top 6 bowlers and batters according to RR and REc – for this reason, his player of the tournament award feels especially justified!

    Looking at that above bowling attack, its not bad. And pretty balanced with leg-spin, off-spin and left-arm spin in it. Would it be good enough to beat the team of the tournament? Or more pertinently, would it beat India in Dubai? It’s hard to think so but it would surely be economical! And that’s half the art, right?

    It’s notable that India had three spinners in the top 15 REc bowlers. This goes to show just how good they all are but also negatively affects the REc of someone like Shami, who relatively suffered playing with such players, according to these stats.

    Shami’s REc per over was 0.08 – meaning he averaged that many runs more per over than his teammates. However, you can’t say he was bad. It’s a quirk of the statistic that it will find value in some players and hide value in others – like all stats.

    So, we have our best bowling attack according to REc but what if we limit it to players who played at least 3 times like we did with the batter rankings above? Well, then we would have something like this as an attack: Ellis and Mulder as our best quicks, Nabi, Rashid, Bracewell, with Ravindra again as an allrounder.

    It looks a bit closer to a bowling attack capable of beating India and interestingly, has no Indians!

    There is one aside to add to this and that is about Nabi, who’s best REc came in the rain-shortened innings against Australia in which he only bowled 3 overs.  If we take that outlier innings out of his analysis (which I think is fair considering just how much it skews his score), we could replace him with a player who bowled in three full innings, someone like Maharaj, for example.

    Bowling Awards

    Best REc accumulated: Michael Bracewell (-5.89)

    Best REc per over (min. 10 overs bowled): Abrar Ahmed (-0.23)

    Best REc in an innings (min. 5 overs): Abrar Ahmed (-2.94) vs India

    Team of the Tournament

    Based on the above numbers, here’s our initial team of the tournament (batted at least twice, bowled at least 10 overs):

    1. Duckett
    2. Zadran
    3. Ravindra
    4. Root
    5. Towhid*
    6. Jaker (wk)*
    7. Nabi
    8. Harshit*
    9. Rashid
    10. Taskin*
    11. Abrar*

    *denotes those who only played twice

    There are a few things that are bothersome about this team. As discussed, Nabi’s numbers were skewed heavily by one half-innings of bowling of only 3 overs. What’s more, it feels odd to include players who only played two matches. After removing the starred players and Nabi, there are a couple things to then resolve in building our final team of the tournament.

    After losing both Harshit and Taskin, the allrounder spot at 7 needs to be a pace bowler and could thus be Azmatullah or Mulder. Mulder makes the top 5 bowlers ahead of Azmatullah but the latter has a superior batting record and a pretty good REc as well. Looking at classic bowling stats, Azmatullah is behind Mulder in terms of average but ahead on wickets and strike rate. It’s genuinely a toss up but I’ll go with Azmatullah at 7 for his all-round success at the tournament and Mulder can be the 12th man.

    The keeper’s slot is another question. If we are going to pick a keeper purely based on RR with no matches-played conditions, we would pick Jaker as above. However, he only played twice and in neither match as a keeper, which makes leaving him out even easier.

    The next keepers in line based on RR are Inglis and Rickelton. The latter batted 3 times but only played as a keeper when Heinrich Klaasen was out injured, what’s more, he’s an opener. For those reasons, I’ll go with Inglis even though he only batted twice, an exception for positional reasons. In his favour, he did play in 3 matches (all as a keeper) and is the best keeper of the three mentioned.

    There is one last question remaining and that is the captain of the side. There is no player in the XI so far that was a team captain at the tournament. For that reason, I am going to select Santner ahead of Maharaj and Noor (one of those would otherwise have made the XI in the bowling group).

    Santner’s REc per over was only slightly worse those two and his captaincy in leading NZ to the final was impressive. It’s convenient he’s another slow bowler, so the team retains balance without having to sacrifice much ability or change the allrounder.

    So, here we have our final RR team of the tournament:

    1. Duckett
    2. Zadran
    3. Ravindra
    4. Root
    5. Van der dussen
    6. Inglis (wk)
    7. Azmatullah
    8. Bracewell
    9. Santner (c)
    10. Rashid
    11. Ellis

    12. Mulder

    It should be noted that while we strayed away from RR and REc slightly to chose a keeper and captain, we haven’t spoken about choosing players based on fielding at all. Someone like Glenn Phillips immediately springs to mind. He hasn’t jumped out of the page in terms of his RR/REc stats but his fielding in the competition and his general all-round abilities got him a place in the official team of the tournament, and that’s fair enough. That’s just not what we’re doing here, but its worth mentioning him as an aside and the issue of fielding in general.

    There’s only one question that remains… could this team beat India in Dubai?

    Interestingly, we’ve come up with a team that is strikingly similar to India’s in terms of construction – we have a bowling split of 2 pacers (with one being an allrounder) and at least 4 spinners. We have finger and wrist spin, left and right arm options. Crucially, the team bats very deep just the champions with Santner down at 9.

    By basing our bowling attack on REc, we have the best options in terms restricting a side’s scoring. As for batting, the players chosen were those who scored in toughest of scenarios.

    I wouldn’t go as far as to say this team is better than India’s but I would say they could run them close, much like NZ and Australia both did… and perhaps even closer. It’s a damn good team, that’s for sure and RR and REc have not only helped us pick the side, but find value that was otherwise going unnoticed in the official team of the tournament.

  • Relative Runs Explained

    Relative Runs© (as well as the associated stats below) offers a novel approach to expressing statistics in cricket. It seeks to capture a complicated issue simply. Namely, Relative Runs aims to provide a simple, transparent, numerical vehicle through which to express the value of a player’ contributions in a cricket match, be that a batter or bowler.

    Whereas standard cricket statistics (e.g. runs, wickets, strike rate & economy) are absolute in nature, Relative Runs offers a way to capture the relative contribution of players.

    This is something we do instinctively when we talk about cricket matches. We frame the performances of players within the story of the match to give them added depth and complexity, to convey value. Relative Runs provides a neat, numerical route to this same end.

    So how does it work?

    It’s pretty simple. Instead of runs being expressed as a raw score, the are expressed relative to a par score in the innings concerned. Take the total of an innings, minus extras, divide it by the number of batters that appeared in the innings and then you have the Par score. The Relative Runs (RR) are equal to a batter’s runs (their real score) minus the Par.

    RR = runs-Par, where Par = (total-extras)/batters

    Let’s take an example. Say in a T20 innings, a team scores 220, where 20 runs were extras, and eight batters appeared at the crease in the innings. The Par score for that innings would be: (220-20)/8 = 25.

    This is to say, the average contribution of a batter was 25 runs. Let’s say one opener got a duck, his Relative Runs will be -25. The first drop, however, scored an impressive century. Imagine he scored 120. His RR is (+)95.

    To put it another way, the opener was 25 runs under par, while the first drop was 95 runs over par. RR thus gives us a very clean way of notating the over- or under-performance of the batters. At it’s core, this is the job RR is doing – we are quantifying over- and under-performance in the game.

    One logical consequence of RR are other stats that follow the same idea. A similar thing can be done for strike rate (SR): Create a par strike rate ((total-extras/balls faced)*100), minus it from a player’s SR and then you have their Relative Strike Rate (RSr).

    The same logic applies to bowlers’ economy rates. Take the innings run rate, minus it from a bowlers economy and you have their Relative Economy (REc).

    You might be wondering why I’ve chosen to derive RR (and the other stats) from just a single innings and not all innings across a match. This is simply because innings across a match can be very different – teams are facing different bowling attacks, at different times, on different states of pitch. The truest demonstration of relative contribution, I believe, is compared with teammates in the same innings.

    What about wickets? Well, you could do the same thing to determine the relative amount of wickets a bowler takes in an innings. However, there is one key difference between wickets and runs-associated stats in cricket. Whereas any amount of runs can theoretically be scored in an innings, only 10 wickets can ever be taken by a bowling side in an innings.

    Because of that absolute maximum, the relative contribution of a bowler in terms of wickets, is information we can glean just from glancing at a bowling analysis. If a bowler has taken three wickets, they have 30 per cent of the total possible wickets. If there were only three wickets taken in the innings, they have 100 per cent of them. This less nuanced than runs-related stats and virtually self-evident.

    Why is this important or interesting?

    Well, it might not be interesting to everyone but there is a persistent problem with the absolute nature of cricket stats. With the huge variance in conditions and scores in cricket, there is no in-built way to measure, for example, one century against another. Two tons, scored in vastly different conditions, against different bowling attacks, in two very different totals, are trivially very different in terms of their value to the team.

    To score 100 when your team scores 600/4 is vastly different to scoring 100 when you’re bowled out for 200.

    Of course, there is no substitute for the entire story of an innings. Relative Runs can’t substitute the total narrative but it does give us a numerical representation of the idea of a relative contribution.

    How much did one batter/bowler contribute to an innings compared to their teammates? RR has an answer to that question. It’s not an exhaustive answer, but an answer that standard cricket stats cannot provide on face value.

    Want to know a bit more about how Relative Runs can be applied to analyse performance? Well, then take a look at this article in which I used RR to review the 2023 Ashes series in England as well as India’s Test tour of West Indies in that same year.