· What if we divide Relative Runs by balls faced across the 2026 IPL season for the best batters?
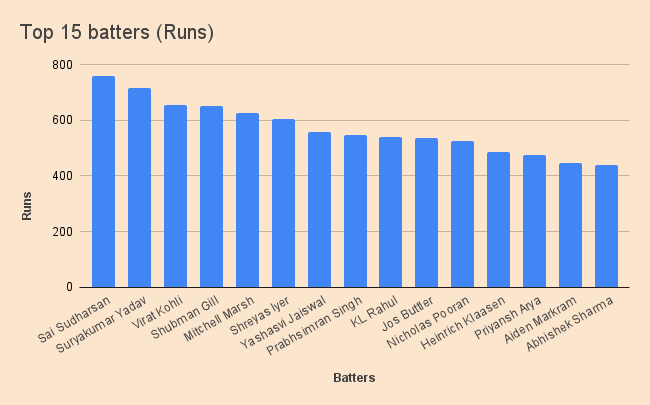
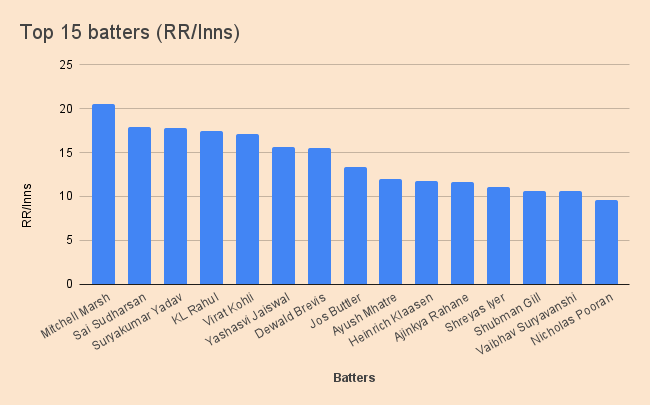
· Sooryavanshi leads this new metric, followed by two LSG batters, just like for ЯR/Inns
· Despite a similar top three, this stat highlights other players (Rickleton in top five, Rizvi and Mhatre make top 15)
One thing that has bothered me for a while is how to elegantly dovetail Relative Runs (ЯR) with the number of balls faced by batsmen to capture a sense of strike rates in the analysis of the numbers.
I have largely been dividing ЯR by batters’ number of innings for longer tournaments like the IPL, as in my larger analysis pieces (see those here: 2025, 2026). This has made intuitive sense and provides a nice way of averaging out Relative Runs over a campaign, in order to analyse batters’ contributions.
However, something has been nagging at me. In T20 cricket specifically, we care about how many balls a batter faces: how many balls they soak up on their way to runs, or rather, how many balls they don’t need to reach a score.
The question was: Is there a way to link this idea to Relative Runs, without referring to Relative Strike Rates (another stat I have invented), or classic strike rates? And then it came to me – so simple and effective – why not just divide the total Relative Runs by the balls faced by a batter across a season?
This is a slightly different way of looking at the numbers across a tournament than via number of innings, but maybe one more in tune with what matters in T20 cricket. That’s because we do care if batters face fewer balls on their way to higher scores, or higher relative scores. We want to highlight the relatively large contributors to a total as well as the quick or efficient contributors.
To explore this idea, I’ve taken another look at the Relative Runs stats I compiled from the 2026 IPL season, and created a new stat: Relative Runs per Ball Faced, or ‘ЯR/BF’. Creating this stat was very simple: I just took the total Relative Runs score for each batter in the season and divided that by their total balls faced for the campaign.
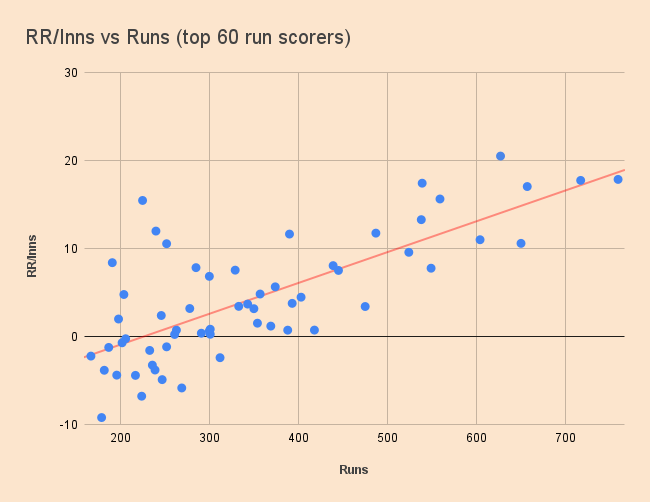
For this analysis, I decided to look at just the top 64 run scorers from the season – that’s the batters who scored at least 150 runs. When we take those batters’ ЯR scores and divide them by balls faced, here is the basic breakdown of the numbers:
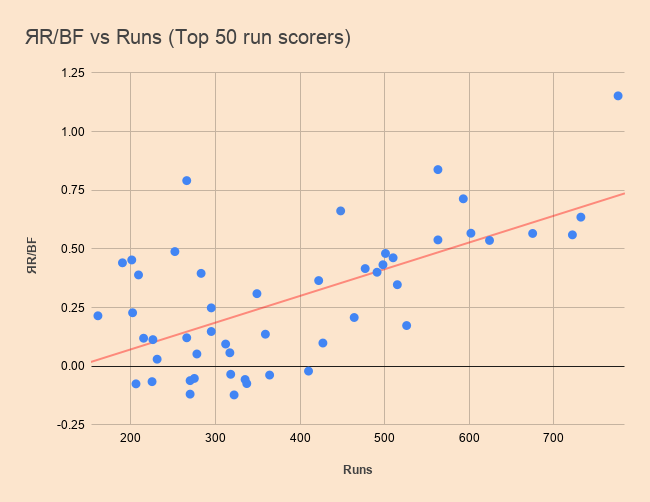
39 batters notched positive scores, while the remaining 25 of the 64 are in negative values. This is the same as for the ЯR/Inns analysis, because it follows that the positive and negative values of the core ЯR scores do not change when divided by different digits (innings or balls faced).
11 of the batters collected ЯR/BF scores over 0.5. This means these 11 batters, arguably the best few, were the only players to score more than 0.5 Relative Runs per ball during the season, on average. Four batters scored over 0.7 ЯR/BF, while just one scored over 1.0 ЯR/BF. Let’s dive in a little deeper…
Sooryavanshi the star (again), Marsh and Inglis impress
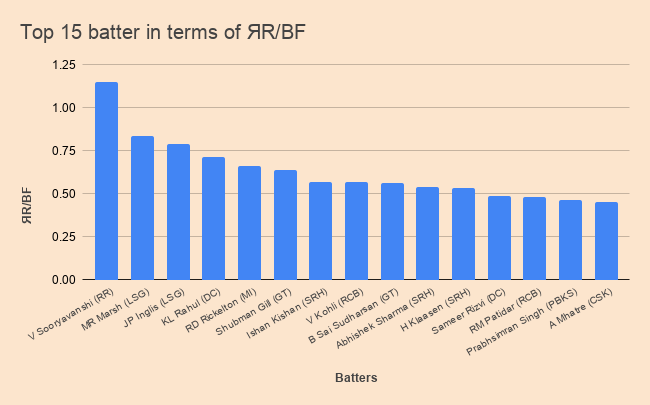
No guesses for who the positive outlier was! Vaibhav Sooryavanshi was the one single batter to generate an ЯR/BF score over 1.0 (1.152). The next best was Mitch Marsh at 0.838. To put this in other terms, Sooryavanshi was the only player in the entire 2026 season to average more than one Relative Run per ball faced.
What does that mean? This is where the concept of a ‘Relative Run’ can get confusing. This is not the same as saying he scored one run more than his teammates per ball faced, but rather that for every ball he faced, he averaged one run more than the Par score of his teammates in each innings. Quite something!
Breaking this down a bit: If Sooryavanshi were to face 10 balls in an innings, we could expect him to score 11.52 more runs than the Par score of his team in that innings. Here’s another fun way to think about that: Sooryavanshi would only need about nine deliveries (8.68, to be precise) to reach 10 Relative Runs. Meaning, on average for the season, Sooryavanshi only needed to face nine balls to eclipse his side’s Par score by 10 runs. That is both slightly mind-bending and damning of his teammates, in equal measure.
For comparison, Marsh, the next best ЯR/BF scorer, needed about 12 balls to score 10 Relative Runs for LSG. Virat Kohli, who notched the eighth-best ЯR/BF score for the season, needed to face almost 18 balls to get 10 Relative Runs for RCB – twice as many as Sooryavanshi. Rohit Sharma needed to face a touch over 25 balls for the same mark. Sooryavanshi’s opening partner at Rajasthan, Yashasvi Jaiswal, had to face 101 balls (in theory) to be expected to score 10 Relative Runs for the Royals in 2026. This is perhaps where it gets a little abstract, but you see the point.
All this is just more ways of proving the same thing: Sooryavanshi had a phenomenal 2026 season. Not just relative to his team, or in terms of these novel stats, but also compared to the entire competition. He scored the most runs at the fastest pace; he got the most Relative Runs, as well as the most Relative Runs per innings and ball faced, too. There really isn’t much competition for him in those terms, but there are some interesting findings further down the list. So who else excelled in terms of ЯR/BF?
Top performers according to the metric
As mentioned, Marsh notched the second-best ЯR/BF score (0.838), and he was followed by his LSG teammate Josh Inglis, who finished on 0.791 and edged Marsh in the ЯR/Inn stats. Both of their scores were close in the two metrics, but this is an interesting finding because Inglis batted at a higher strike rate for the season (186.01 vs 163.18), and yet scored lower on ЯR/BF. Marsh’s overperformance in terms of scoring relative to his teammates has powered his ЯR/BF past his peer with a superior strike rate for the season, surprisingly.
Delhi’s KL Rahul comes in fourth place on 0.713 ЯR/BF, and rounding out the top five is Mumbai’s Ryan Rickleton with 0.662. It is interesting to see how this top five looks a bit different to the top five in terms of ЯR/Inns, with Rahul rising past Shubman Gill (0.635), and Rickleton leapfrogging also Kohli (0.566), Sai Sudharshan (0.560), and Heinrich Klaasen (0.536) in this metric.
Filling out the top 11 of players who tipped over 0.5 for ЯR/BF are Klaasen’s SRH teammates Ishan Kishan (seventh at 0.567) and Abhishek Sharma (10th at 0.538). Punjab’s top scorer, Prabsimram Singh, was in the top 11 for ЯR/Inns but in terms of ЯR/BF he comes in at 14th, with 0.462.
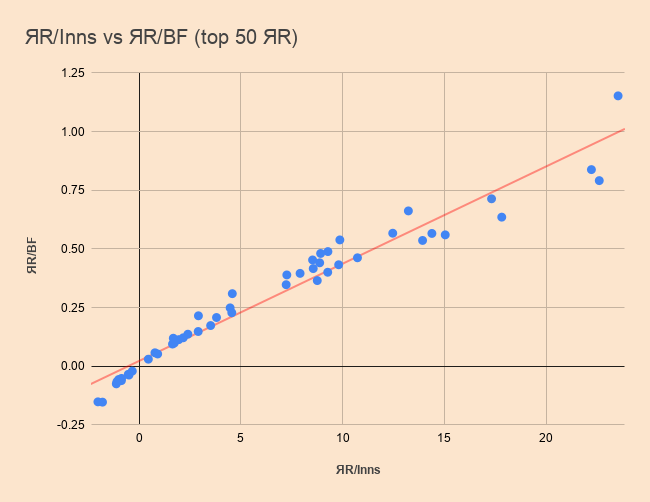
Generally speaking, the guys with slightly weaker strike rates have slid down the list in terms of ЯR/BF, which completely makes sense, because this new stat favours faster scorers. Conversely, guys like Ishan and Rickelton, who struck at over 180, have moved up the list in terms of ЯR/BF, which is sort of what we want to see from this stat – some dovetailing of Relative Runs and strike rates, at least to an extent.
However, this is not always the case, as highlighted by Marsh leading Inglis in terms of ЯR/BF. Marsh only struck at 163.18 for the season, scoring the eighth most runs in the league. However, it was his huge overperformance in relation to his teammates in scoring that sees him with the second most Relative Runs, and also second most per ball faced.
Some of the players we highlighted in the ЯR/Inns analysis also pop up high on the ЯR/BF list, too. Sameer Rizvi (0.488) was 12th best in the league; Ayush Mhatre (0.453) came in at 15th, with Rovman Powell (0.441) just one after him.
Rohit (0.396) was 20th best in terms of ЯR/BF. Sarfaraz Khan, who was one of the more surprising positive finds in the initial analysis, popped up with the 27th-best ЯR/BF score in the whole season (0.215), remarkably. To put him into context, he is wedged in between RCB stars Phil Salt (0.228)and Devdutt Padikkal (0.208) in terms of this metric in the list of 64 batters.
Poor performers according to the metric
In terms of the players whose ЯR/BF stats are not as good as their run stats look, Jos Buttler stands out. He was one of only 13 players to score over 500 runs for the season, and yet his ЯR/BF score (0.173) is 29th in the list. Jaiswal came way down in 35th place (0.099), despite scoring 427 runs.
Travis Head is a player we didn’t mention much in the ЯR/Inns analysis because his ЯR stats were just below zero, and we focused on the positive performers. Interestingly, Head was the only player to score over 400 runs and have negative ЯR numbers, landing on -0.021 for ЯR/BF. Rahul Tewatia was the worst-performing player among the top 64 batters in terms of ЯR/BF, and the only one to fetch a score lower than -1.0 (-1.488).